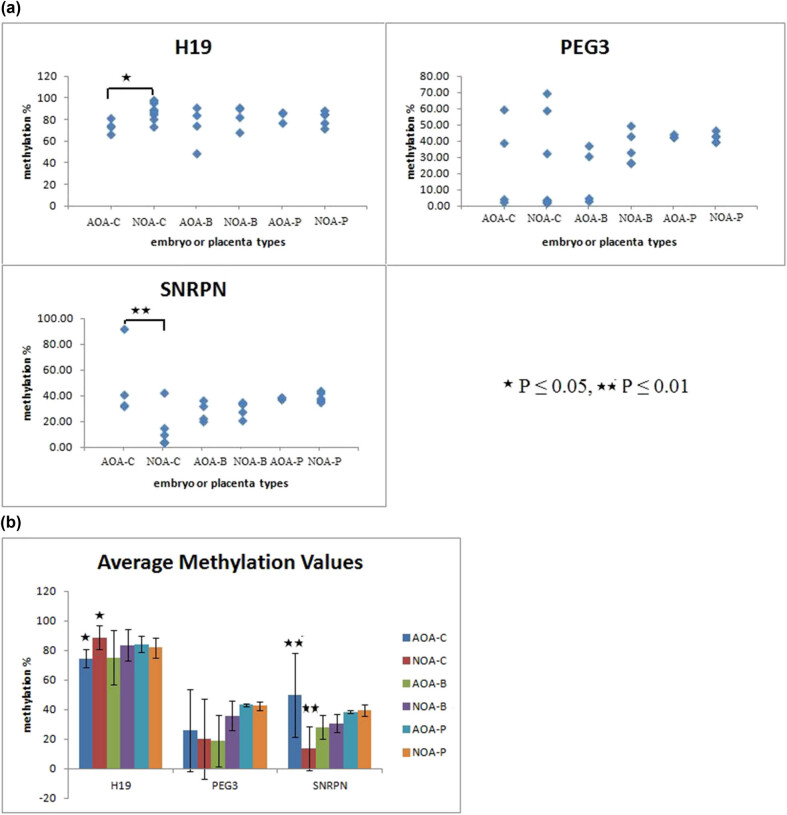
Figure 1.
Pyrosequencing analysis of DNA methylation at three imprinted genes for different types of embryos or placentas. (a) The global methylation percentage in the methylated allele of H19, PEG3, and SNRPN for different embryos or placentas. Each dot corresponds to an embryo or a placenta. (b) Average methylation values plotted with standard deviation values for a different group. For genes H19 and SNRPN, the difference between AOA-C and NOA-C was significant (P ≤ 0.05 and P ≤ 0.001).

