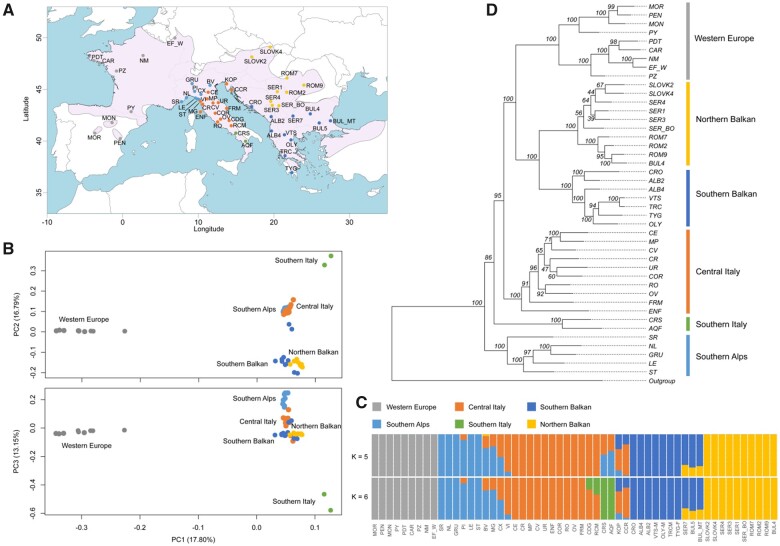
Fig. 1.
Population genetic and phylogenetic analyses of Podarcis muralis. (A) The sampling localities for the RAD-Seq part of this study. The pink area represents the distribution range of P. muralis. For sampling locations of WGS samples, see supplementary fig. S1, Supplementary Material online. (B) PCA plots of genetic distance for all 55 individuals based on RAD-Seq data. (C) Admixture clustering of individuals into five and six groups (K). The proportion of each individual’s genome assigned to each cluster is shown by the length of the colored segments. (D) Maximum likelihood phylogeny inferred based on RAD-Seq data. The numbers above branches indicate the bootstrap values for each node. For all panels, genetic lineages are color-coded consistently.

