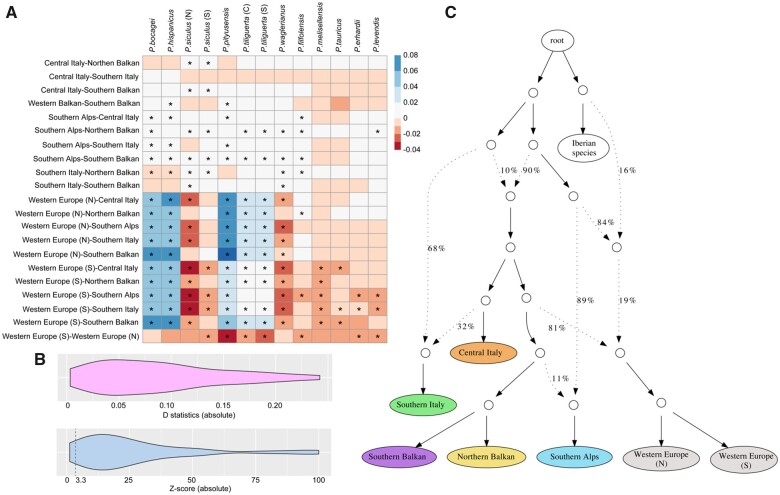
Fig. 3.
Analyses of gene flow for Podarcis muralis lineages. (A) Interspecific introgression analyses between P. muralis and other Podarcis species using four-taxon D statistics with the test (muralis_A, muralis_B, target_taxon, outgroup). The lineage pairs of P. muralis are listed on the Y axis, and the targeted non-muralis species are listed on the X axis. The coloration of each square represents the D statistics, and the asterisk (*) indicates significant deviations from neutrality based on z-scores. (B) Distribution of D statistics and z-scores of intraspecific introgression analysis between P. muralis lineages. The result showed that most tests significantly deviated from neutrality. We list detailed information in supplementary table S4, Supplementary Material online. (C) Admixture graph of P. muralis generated by qpGraph. Solid lines with arrows indicate tree-like evolution, whereas dashed lines with arrows indicate admixture events. The numbers next to branches represent the proportion of alleles from a parental node.

