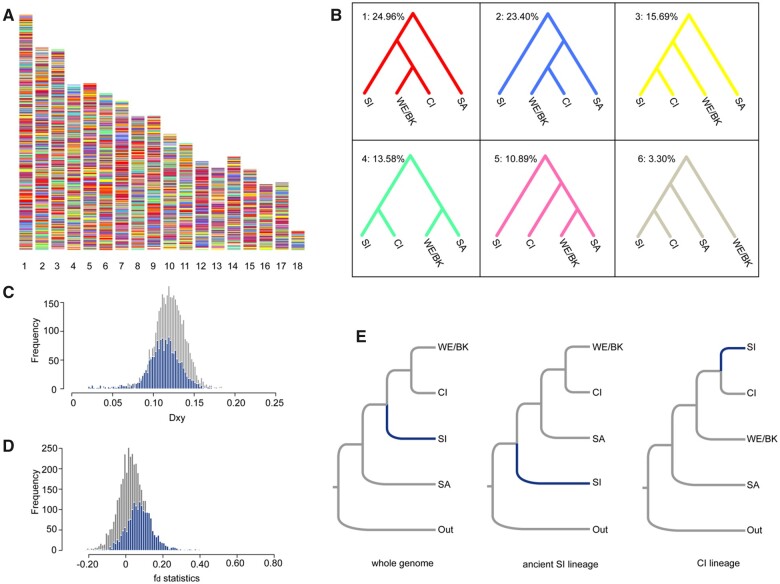
Fig. 4.
The ancestry and phylogenetic position of the Southern Italy lineage. (A) The distribution of local tree topologies across the genome. (B) The six most common topologies with the corresponding coloration as in panel (A). The value on the top left is the percentage of all 200 kb windows supporting the specific topology. (C) The distribution of Dxy between the two lineages for the CI-ancestry part of the genome (blue) and the rest of the genome (gray). (D) The distribution of fd statistics between the two lineages for the CI-ancestry genome (blue) and the rest of the genome (gray). (E) Multispecies coalescent tree topologies for distinct portions of the genome: whole genome, the ancient SI lineage part, and the CI-ancestry part of the genome.

