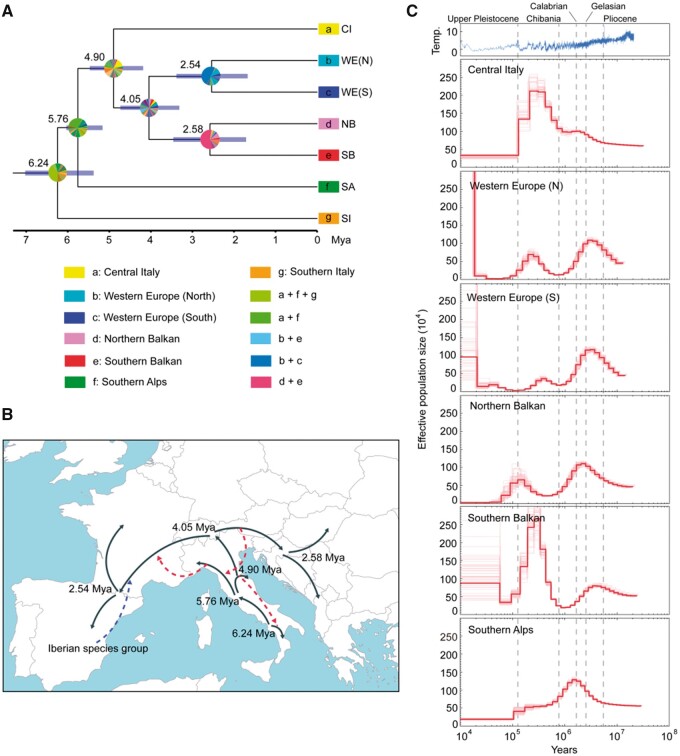
Fig. 5.
Biogeography and demographic dynamics for Podarcis muralis. (A) Time-calibrated phylogeny for P. muralis lineages with ancestral area reconstructions. The numbers indicate the estimated ages for each node. The blue bars represent the confidence intervals of divergence times. The colored squares at tip nodes represent the current distribution ranges of lineages in seven biogeographic regions, and the pie charts indicate the proportional posterior probability of ancestral ranges inferred by the best-fitting model DIVALIKE. (B) Illustration of the inferred biogeographic history of P. muralis on a map of contemporary Europe. The solid lines with arrows indicate the tree-like divergence and dispersal. Dashed lines with arrows indicate interspecific introgression (blue) or intraspecific introgression (red). (C) Demographic history of five major P. muralis lineages (note that both Northern and Southern WE are shown in separate panels). Effective population size over time was estimated using the pairwise sequential Markovian coalescent model. The red lines represent the population dynamics, and the light red lines represent the results of 100 bootstrap replicates. The dash lines indicate the start of geological periods. The top panel shows the dynamics of global temperature.

