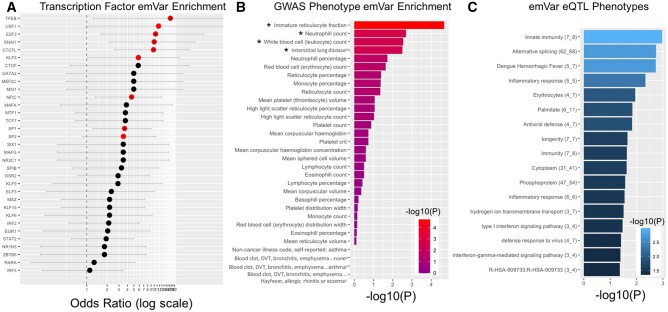
Fig. 4.
Phenotypic analysis of emVars. (A) Transcription factor-binding site enrichment analysis comparing the number of predicted changes to TF-binding motifs by emVars compared with non-emVars. Enrichments are reported as Fisher’s OR with lines indicating confidence intervals. Significant enrichments (P < 0.05) are colored in red, those surviving FDR correction (FDR<0.1) are denoted with an asterisk. (B) Enrichment analysis of all tested alleles and emVars with GWAS data acquired from the Neale Labe (http://www.nealelab.is/uk-biobank/, last accessed November 19, 2021) (see Materials and Methods). Asterisks indicate four phenotypes for which emVars are significantly enriched relative to tested non-emVars after FDR correction (P < 0.05, FDR<0.05). (C) Enrichment analysis using DAVID (Huang et al. 2009a, 2009b) of emVar response genes determined via eQTL analyses in immunologically relevant cell lines. The background set is the entire human genome. A number of highly relevant immunological phenotypes are observed as significantly enriched. The number of response genes and emVars is denoted next to each phenotype in the form “Phenotype Name (#Genes_#emVars).”

