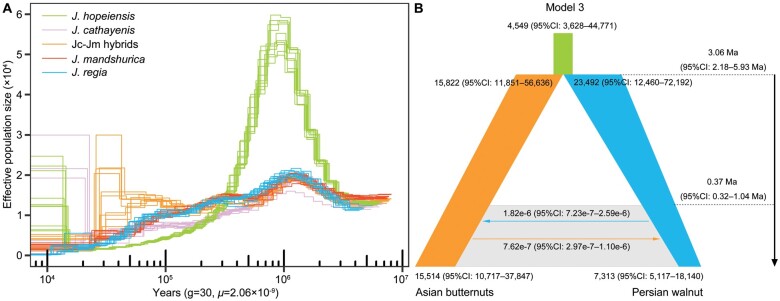
Fig. 3.
Inferring population demographic history. (A) Changes in effective population size (Ne) over the past 4.5 My in Asian butternuts and Juglans regia as inferred with PSMC. Within J. hopeiensis and Jc–Jm hybrids, results were obtained by using J. mandshurica as the reference genome. Each color and line represent one group and individual, respectively, and g, generation time (year), μ, mutation rate (per site per year). (B) Simplified graphical summary of the best-fitting demographic model inferred by fastsimcoal2 based on SNPs from Asian butternuts and Persian walnut. The joint past population is shown as the light green bar. Gray-shaded area and arrows indicate the bidirectional gene flow. The orange and blue bars represent Asian butternuts and Persian walnut. Populations of Asian butternuts and Persian walnut were set to decline from past to present based on the PSMC results.

