
FIGURE 4.
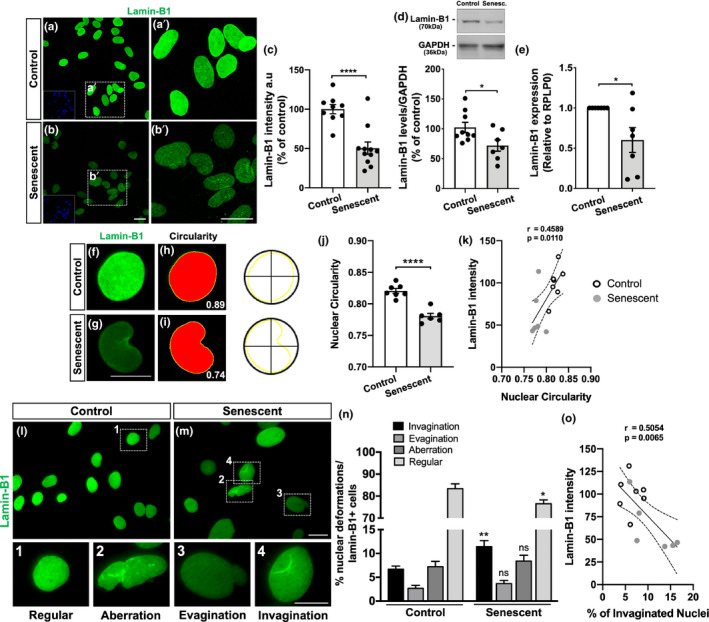
Nuclear deformations are associated with lamin‐B1 loss in senescent astrocytes. (a–c) Reduced immunostaining for lamin‐B1 in senescent astrocytes compared with the control group (p < 0.0001). (d) Lamin‐B1 protein levels were diminished in senescent astrocytes in comparison with the control group (p = 0.0329). (e) Senescent astrocytes showed decreased expression of lamin‐B1 (p = 0.0417). (f–i) Nuclear circularity analysis is based on the area and perimeter of the nucleus. Circularity has a maximum value of 1 and diminishes as the nuclear shape becomes increasingly convoluted, as observed in senescent cells (g, i). (j) Senescent astrocytes displayed reduced nuclear circularity compared with the control group (p < 0.0001). (k) A positive correlation was observed between lamin‐B1 intensity and the nuclear circularity value (r = 0.4589; p = 0.0110). (l, m) Distinct nuclear morphological profiles were evaluated, such as regular (1), aberration (2), evagination (3), and invagination (4) in control and senescent cultured astrocytes, based on lamin‐B1 staining. (n) Senescent astrocyte showed an increased incidence of invaginated nuclei (p = 0.0054) and a decreased proportion of regular nuclei (p = 0.0263). (o) A negative correlation was observed between lamin‐B1 intensity and the incidence of invaginated nuclei (r = 0.5054; p = 0.0065). Significance was determined using unpaired t test with Welch's correction. Linear regression opting to show 95% confidence bands of the best‐fit line. Error bars represent ±SEM. Individual data points are plotted and represent individual cultures (n = 6–11 cultures per experimental condition). Control cultures are represented by white dots and senescent cultures by gray dots in (k) and (o). Scale bars, 20 µm in (b), (b′) and (M); 10 µm in (g) and (4)