
FIGURE 1.
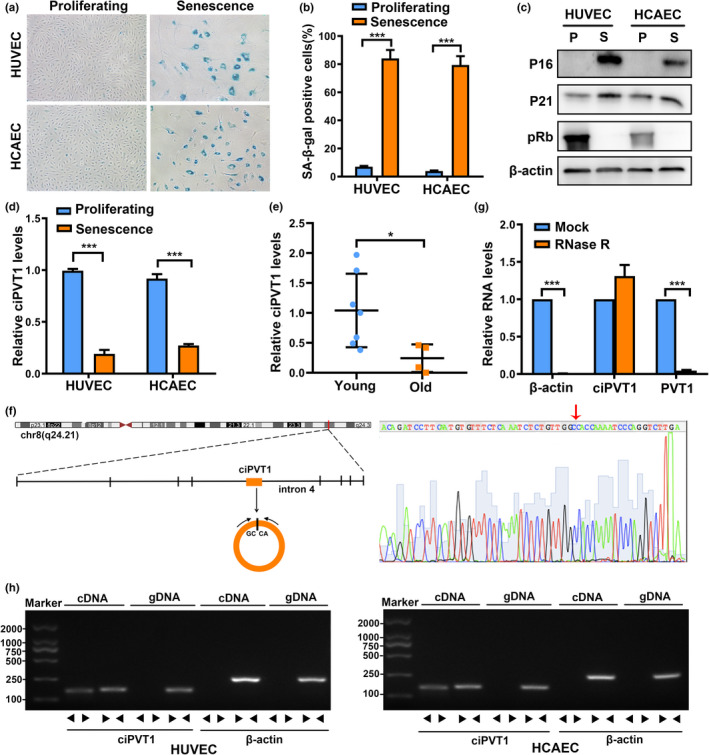
Validation and characteristics of ciPVT1 in ECs. (a) Micrographs to visualize SA‐β‐gal activity in proliferating and senescent ECs. (b) SA‐β‐gal staining positive cells were counted and presented as percentage of total cells. (c) Western blot analysis of the levels of P21, P16, pRb, and β‐actin in proliferating (P) and senescent (S) ECs. (d) RT‐qPCR analysis of ciPVT1 expression in proliferating and senescent ECs. (e) The expression levels of ciPVT1 were validated in blood vessels of young (n = 7) and old (n = 4) individuals using RT‐qPCR. (f) Scheme illustrating the production of ciPVT1. PCR primers used to specifically detect ciPVT1 by RT‐qPCR are indicated by black arrows. The presence of ciPVT1 was validated by RT‐PCR, followed by Sanger sequencing. Red arrow represents “head‐to‐tail” ciPVT1 splicing sites. (g) RT‐qPCR analysis of ciPVT1 and PVT1 RNA after treatment with RNase R in HUVECs. The relative levels of ciPVT1 and PVT1 RNA were normalized to the value measured in the mock treatment. (h) RT‐PCR or PCR assay indicating the detection of ciPVT1 using divergent and convergent primers from cDNA or genomic DNA (gDNA) of ECs. β‐actin was used as negative control. Data are presented as mean ± SD; *p < 0.05, ***p < 0.001