
FIGURE 2.
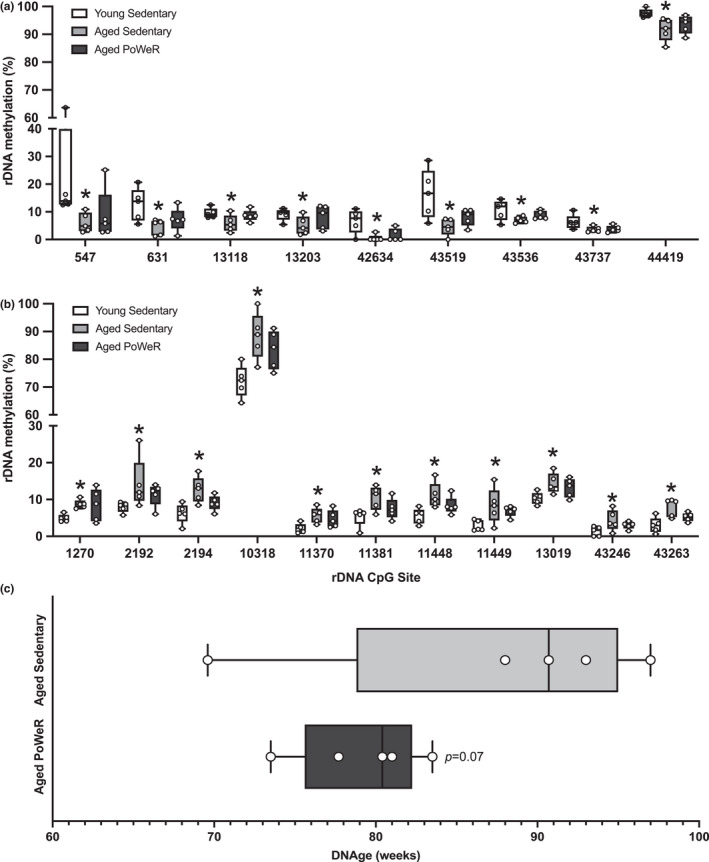
Ribosomal DNA (rDNA) methylation and DNAge™ analysis. (a) rDNA CpGs (listed by chromosomal position) hypomethylated in muscle from aged sedentary versus young animals (*FDR<0.05), but not hypomethylated in muscle from aged PoWeR versus young animals. (b) rDNA CpGs (listed by chromosomal position) hypermethylated in muscle from aged sedentary versus young animals (*FDR<0.05), but not hypermethylated in muscle from aged PoWeR versus young animals. (c) DNAge™ analysis of muscle from aged sedentary versus aged PoWeR muscle, analyzed using a directional t‐test. A generalized linear model accounting for all groups was used to determine differential methylation in (a) and (b), with a correction for multiple comparisons by controlling false discovery rate (FDR) using the Benjamini–Hochberg method (α = 0.05); histograms depict median with a line