
FIGURE 7.
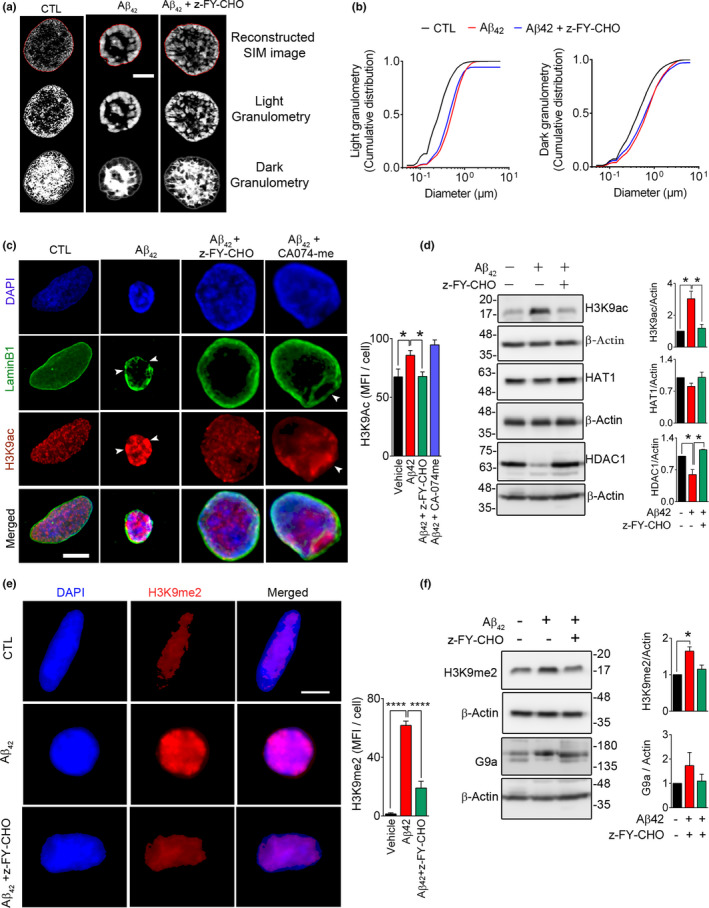
Lamin B1 damage in Aβ42 toxicity affects nuclear architecture and chromatin remodeling. To examine the effect of LB1 invagination observed in Aβ42 toxicity, we exposed the SH‐SY5Y cells to Aβ42 (5 µM, 16 h), with/without pre‐treatment with CTSL inhibitor (z‐FY‐CHO, 20 µM). (a) Micrographs representing 3D‐Struture Illumination Microscopy (3D‐SIM) of DAPI‐stained cells. (Scale bar = 1 µm) (b) Granulometry analysis of images in a is shown by graph (cumulative distribution vs size in µm). A minimum of 39 cells/condition were analyzed. Data are representative of two independent experiments and reported as mean ± SEM. Statistical analysis (one‐way ANOVA/Tukey's post hoc) showed that administration of Aβ42 significantly increased DNA compaction, as shown by light granulometry: (p = 1.1744E‐138) that was prevented in cells pre‐treated with z‐FY‐CHO (p = 0.700E‐04). DNA‐free space, assessed by dark granulometry, was also increased after Aβ42 administration (CTL vs. Aβ42, p = 5.7328E‐17), although it did not fully recover after inhibition of CTSL (Aβ42 + z‐FY‐CHO: p = 0.5810). (c) Representative 3D confocal microscopy depicting epigenetic changes (H3K9ac) associated with lamin B1 damage. While inhibition of CTSL (z‐FY‐CHO, 20 µM) robustly alleviated these changes, inhibition of CTSB (CA074‐me, 20 µM) was not equally effective. Quantitative analysis of H3K9ac mean fluorescence intensity (MFI)/cells (n ≥ 46 cells/treatment group) is shown as a bar graph. Data are representative of three independent experiments and reported as mean ± SEM, *p < 0.05 (one‐way ANOVA/Tukey's post hoc), Scale bar = 10 µm. (d) To gain a mechanistic view of molecular changes in acetylation, Western blotting was performed, showing that the increase in H3K9ac was due to decreased HDAC1 levels in Aβ42 treated cells and was normalized by inhibition of CTSL. n = 2 independent experiments, data are mean ± SEM. *p < 0.05 (one‐way ANOVA/Tukey's post hoc). (e) Confocal micrographs depicting changes in H3K9me2 in this experimental model. Mean fluorescence intensity for H3K9me2 was analyzed (n ≥ 41 cells/conditions) and reported as mean ±SEM. ****p < 0.0001 (one‐way ANOVA/Tukey's post hoc), Scale bar: 10 µm. (f) H3K9me2 and G9a were probed for Western blotting after treating SH‐SY5Y cells as stated in e. Quantitative bar graphs of the indicated protein levels. Data reported as mean ± SEM. *p < 0.05 (one‐way ANOVA/Tukey's post hoc)