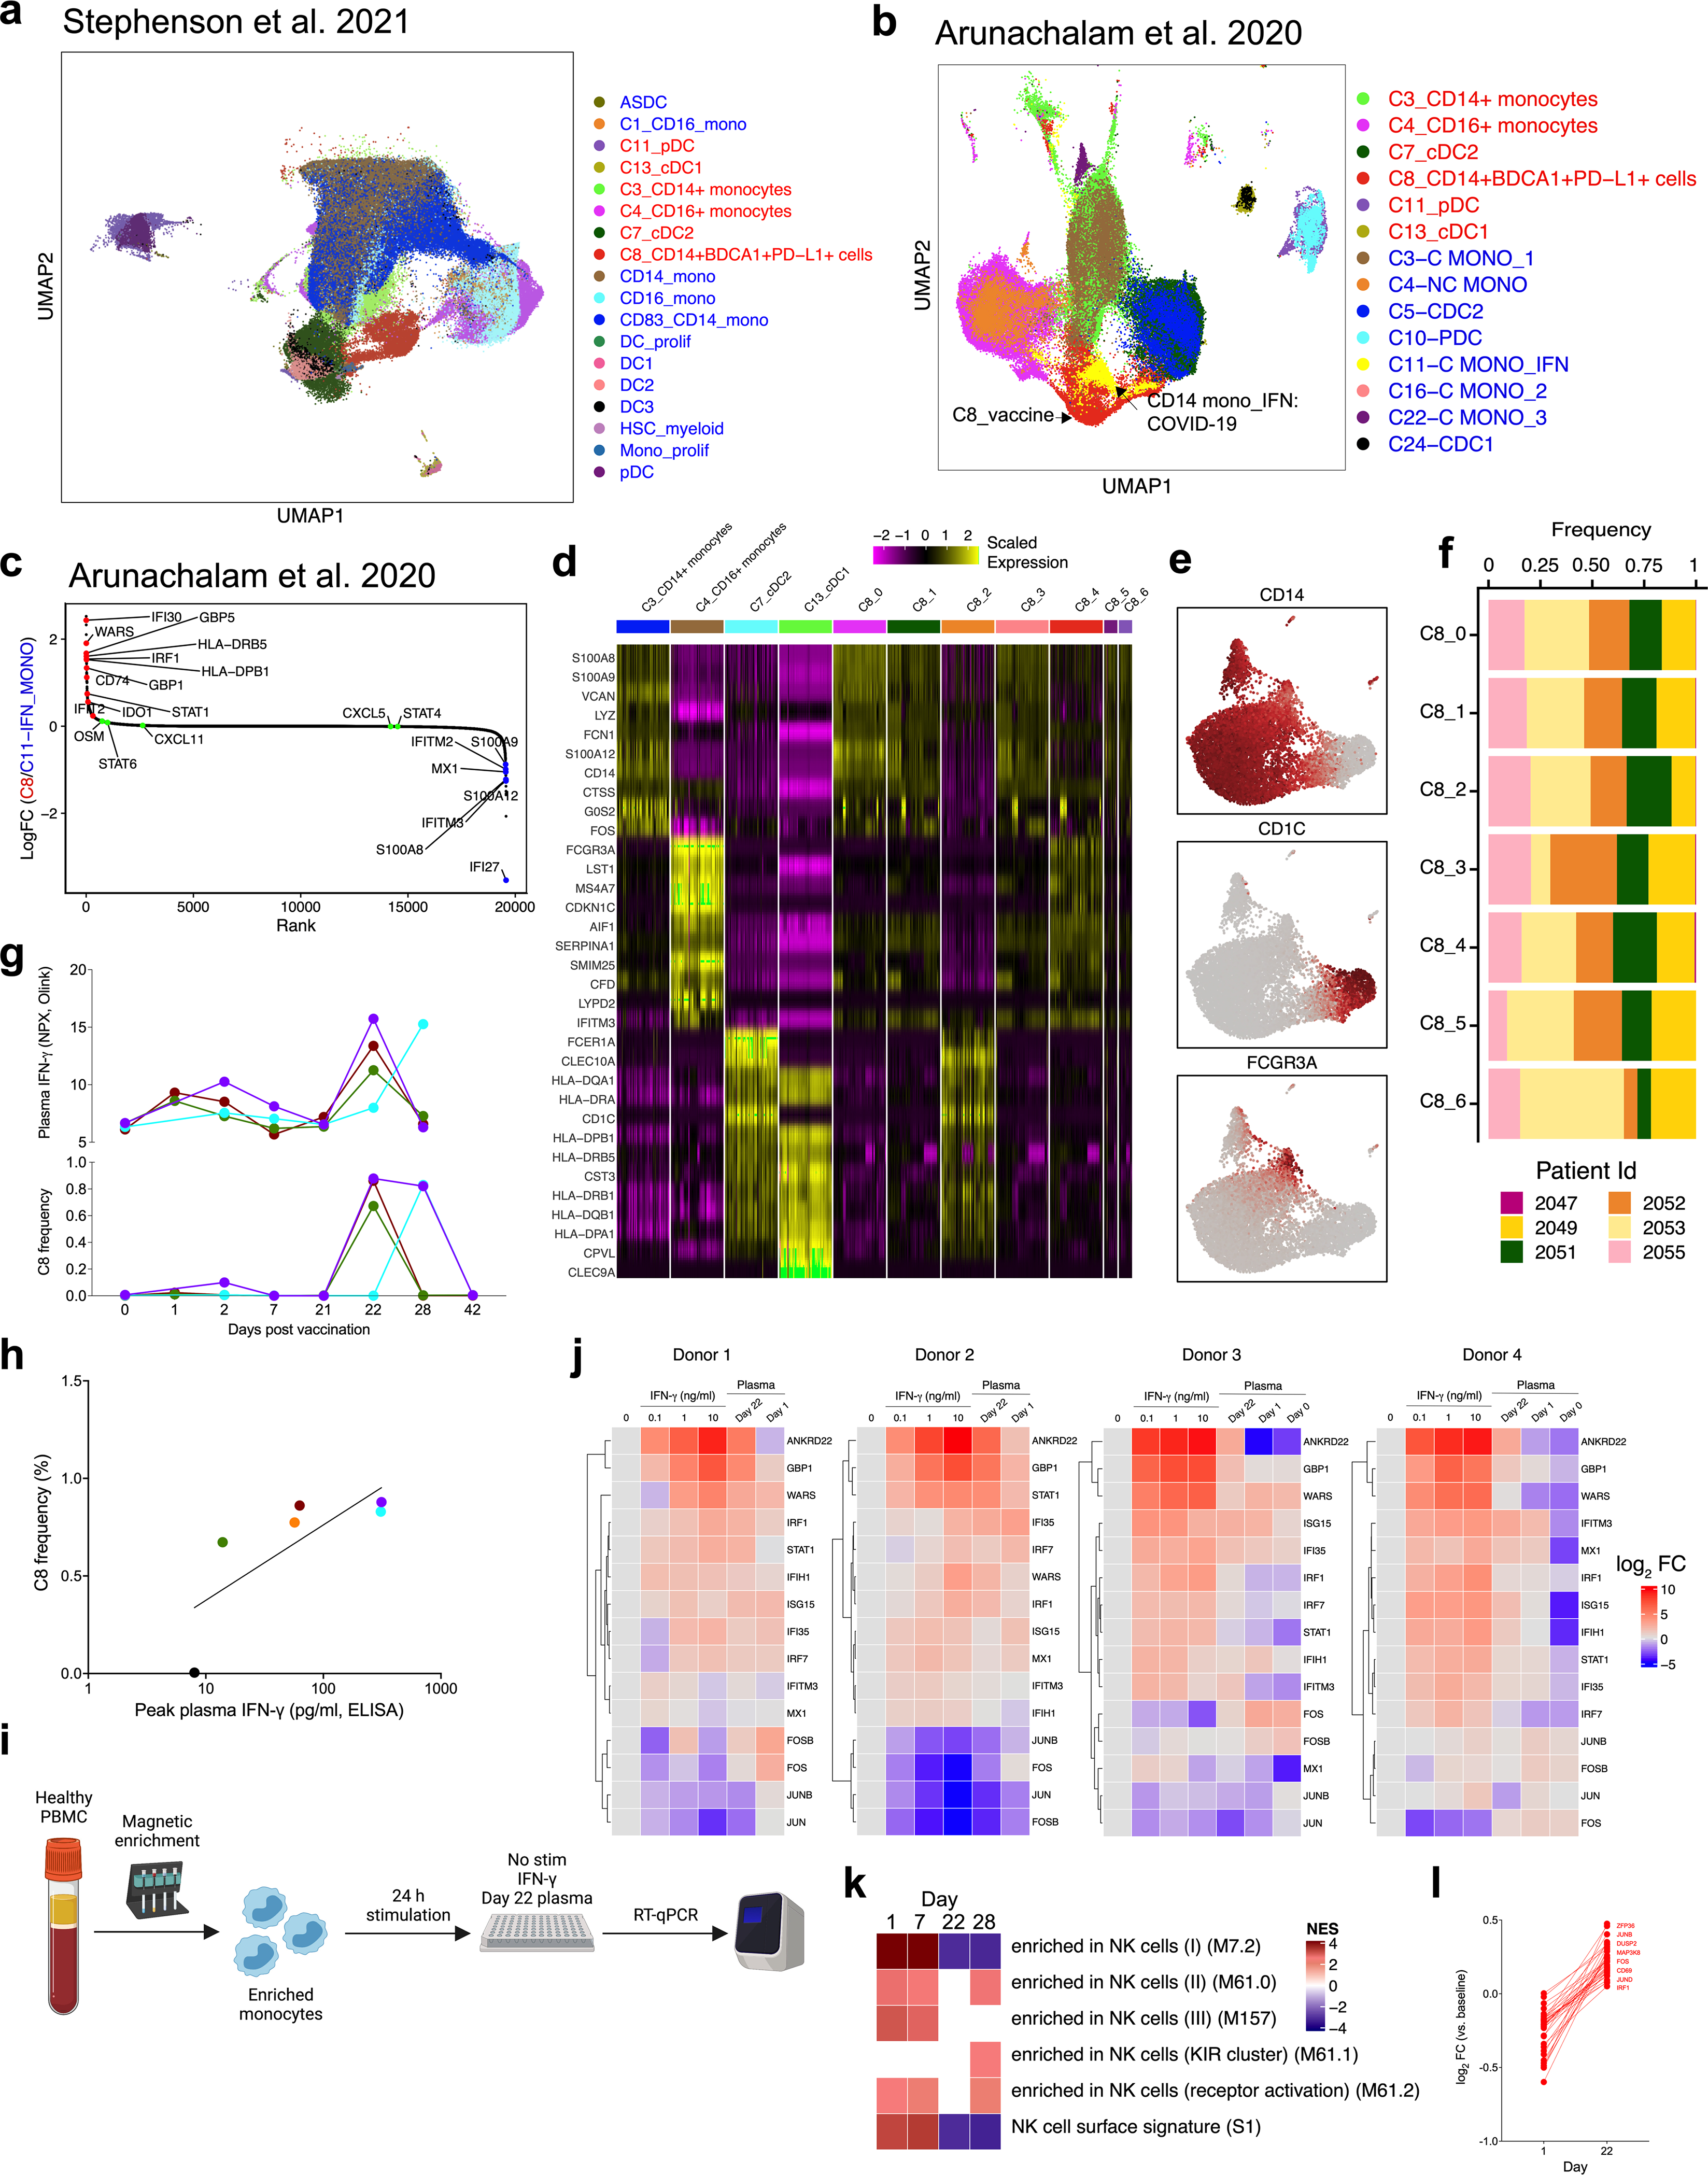
Extended Data Fig. 10 |. Analysis of gene expression within cluster C8.

a, b, UMAP representation of 71,276 innate immune cells (myeloid cells + pDCs) from this study combined with innate cells from ref. 23 (a, 154,108 cells) or ref. 4 (b, 18,926 cells). Red and blue fonts on the legends denote cell clusters defined in the current study versus previously published studies. c, Rank plot showing genes overexpressed in cluster C8 from this study in comparison to IFN-experienced monocyte cluster (‘C11_C Mono_IFN’). Genes expressed more in C8 are in red font; genes in blue font are expressed at a higher level in C11_C Mono_IFN. d, Heat map showing genes in C3 CD14+ monocytes, C4 CD16+ monocytes, C7 cDC2 and C13 cDC1 that are shared with C8 subclusters and are closest with the parental clusters on the basis of Euclidean distance. e, Feature plots showing expression of CD14, CD1c or CD16 within C8 subclusters. f, Fraction of cells in each subcluster of C8 classified by subject. g, Frequency of C8 as a proportion of Lin− HLA-DR+ population (bottom) or plasma IFNγ levels (top) as measured in Olink. h, Correlation between C8 frequency and plasma IFNγ levels measured by enzyme-linked immunosorbent assay. i, Schematic of the experimental set up for in vitro stimulation of purified healthy monocytes with IFNγ and day-22 plasma from vaccinated participants. j, Heat maps showing expression of genes measured by quantitative real-time PCR (qRT–PCR) relative to the ‘no stimulation’ condition. Each column shows the condition as shown on the top. Each row represents a gene quantified by qRT–PCR. Five hundred thousand PBMCs from four donors were treated with different concentration of IFNγ, 1:4 diluted plasma sample from day 0, 1 or 22. k, Significantly enriched natural killer cell modules (FDR < 0.05, absolute NES>2) within the natural killer cell cluster. Days 1 and 7 were compared against day 0; days 22 and 28 were compared against day 21. GSEA was used to identify increased (red) or decreased (blue) enrichment of interferon BTMs. l, log2-transformed fold change of top 50 DEGs between natural killer cells from day 22 samples versus day 1 samples.
