
Fig. 2 |. Innate immune responses induced by BNT162b2 vaccination.
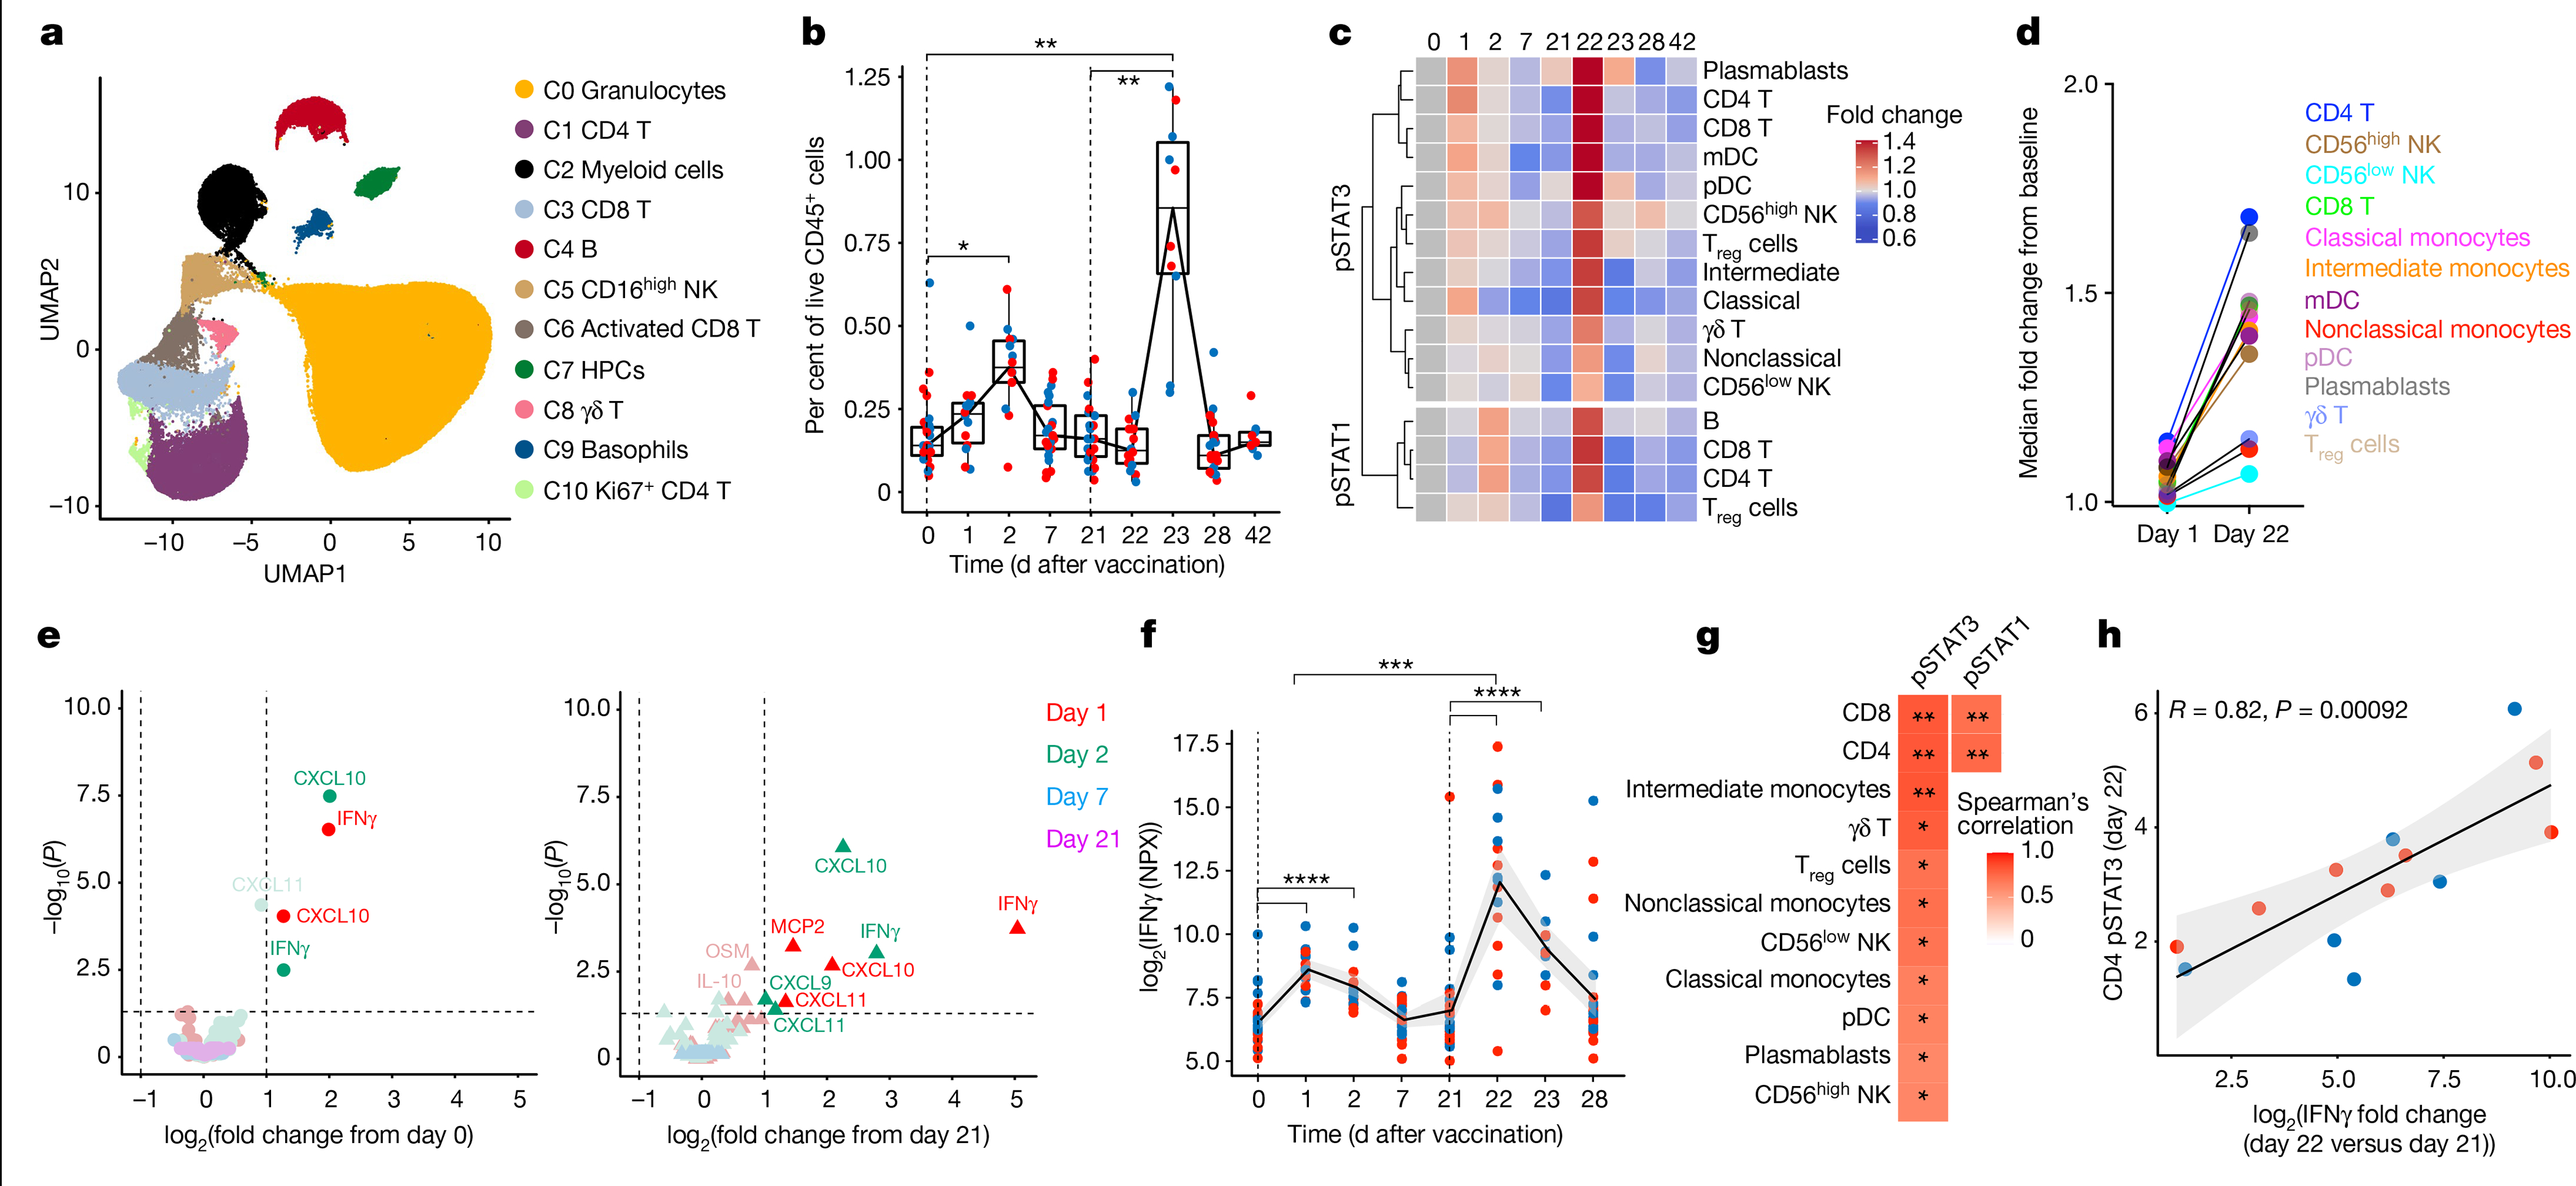
a, CyTOF-identified cell clusters from whole blood visualized by uniform manifold approximation and projection (UMAP). HPCs, haematopoietic progenitor cells; NK, natural killer. b, Frequency of inflammatory monocytes (CD14+CD16+ monocytes) as a proportion of live CD45+ cells. Boxes show median and 25th–75th percentiles, and whiskers show the range. c, Heat map of fold change of pSTAT3 and pSTAT1 levels in comparison to baseline in the cell types indicated on the y axis. Only statistically significant changes between the increase on day 1 after primary and day 1 after secondary immunizations, as measured using two-sided Mann–Whitney rank-sum test (P < 0.05), were plotted. mDC, myeloid dendritic cell; pDC, plasmacytoid dendritic cell; Treg, regulatory T. d, Fold change in pSTAT3 levels on days 1 and 22, compared to primary and secondary baselines, respectively. e, Volcano plots showing plasma cytokines significantly increased after primary (left) and secondary (right) vaccinations versus day 0 and day 21, respectively. f, Plasma IFNγ levels measured by Olink. NPX, normalized protein expression. g, Heat map of two-sided Spearman’s correlation between increase in plasma IFNγ and pSTAT3 or pSTAT1 levels in different cell types, shown on the y axis, on day 1 after secondary vaccination. The P values were corrected for multiple testing. h, Spearman’s correlation between pSTAT3 levels in CD4 T cells and plasma IFNγ levels. The error bands represent 95% confidence limits. In b, f, statistical differences between the peak and baseline time points were measured using two-sided Wilcoxon matched-pairs signed-rank test. The differences between peak time points were measured using two-sided Mann–Whitney rank-sum test. *P < 0.05, **P < 0.01, ***P < 0.001, ****P < 0.0001. Blue and red dots indicate female and male participants, respectively. n = 27 and 31 participants for CyTOF and Olink.