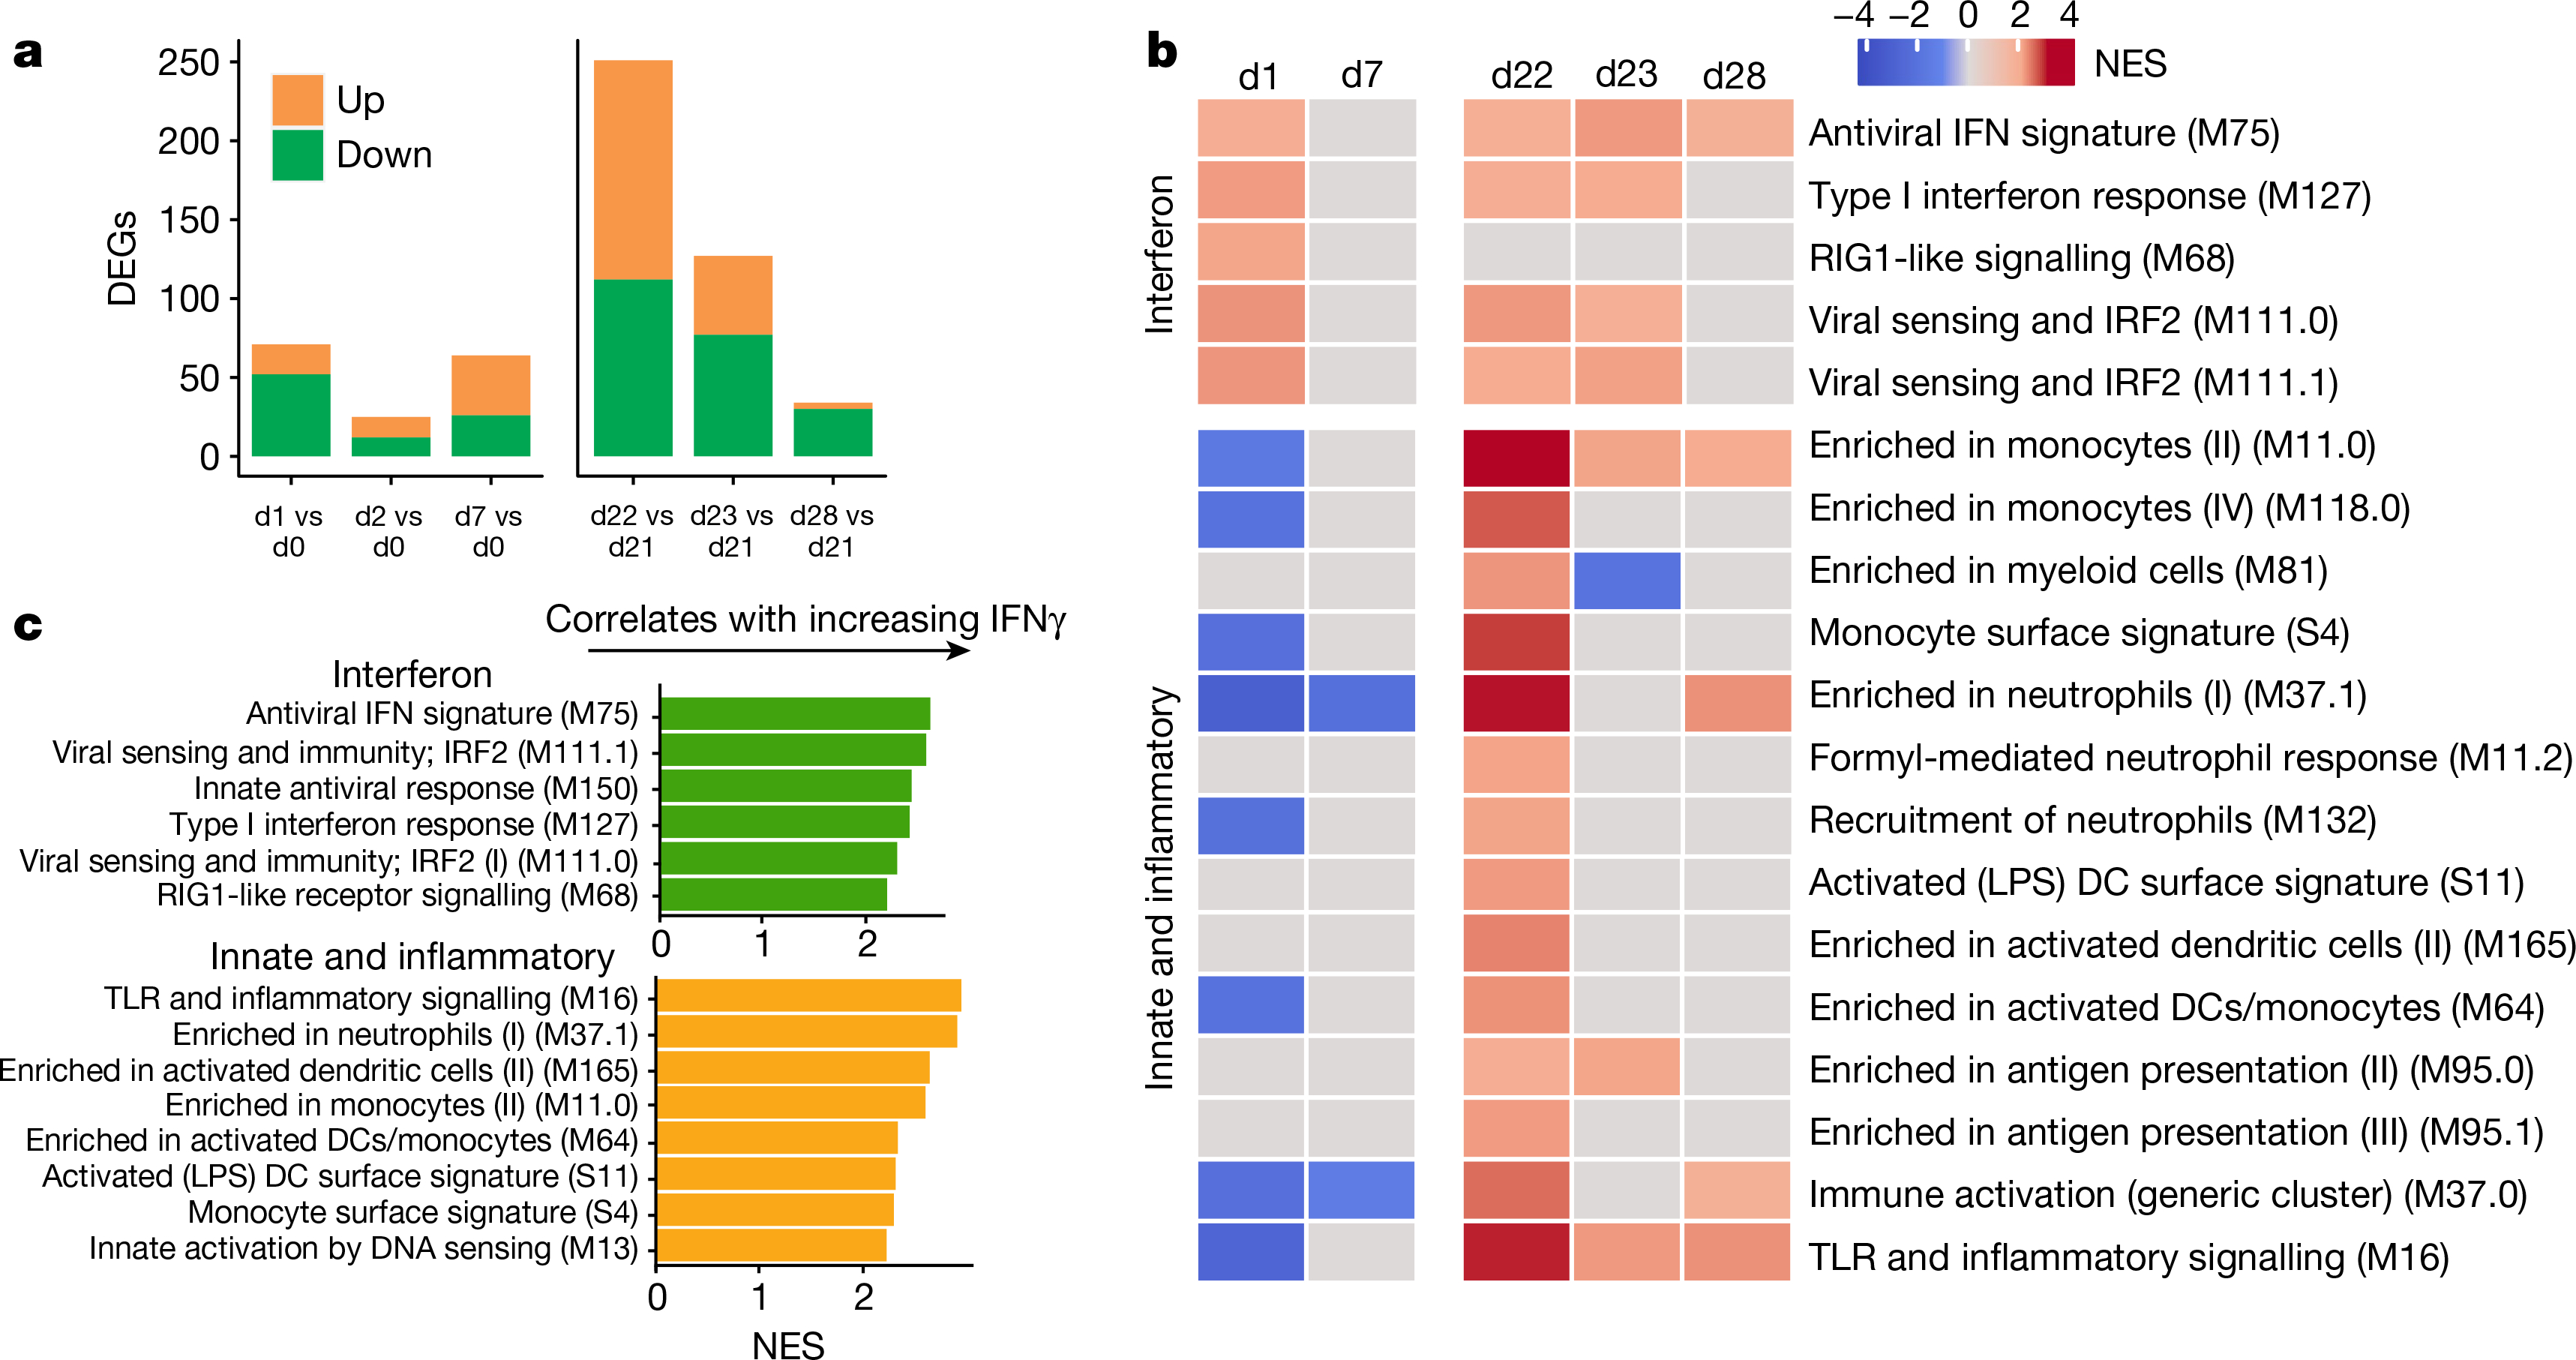
Fig. 3 |. Transcriptional signatures of BNT162b2 vaccination.

a, Number of differentially expressed genes (DEGs) (absolute log2-transformed fold change > 0.2 and Wald P < 0.01) at each time point after prime (left) and boost (right). d, day. b, Interferon and innate BTMs that were significantly enriched (false discovery rate (FDR) < 0.05, absolute normalized enrichment score (NES) > 2) after prime (left) and boost (right) vaccination. Days 1, 2 and 7 were compared against day 0; days 22, 23 and 28 were compared against day 21 in a, b. c, BTMs on day 22 that were significantly associated with plasma IFNγ. GSEA was used to identify enrichment of BTMs within gene lists ranked by correlation with fold change in IFNγ between days 22 and 21.
