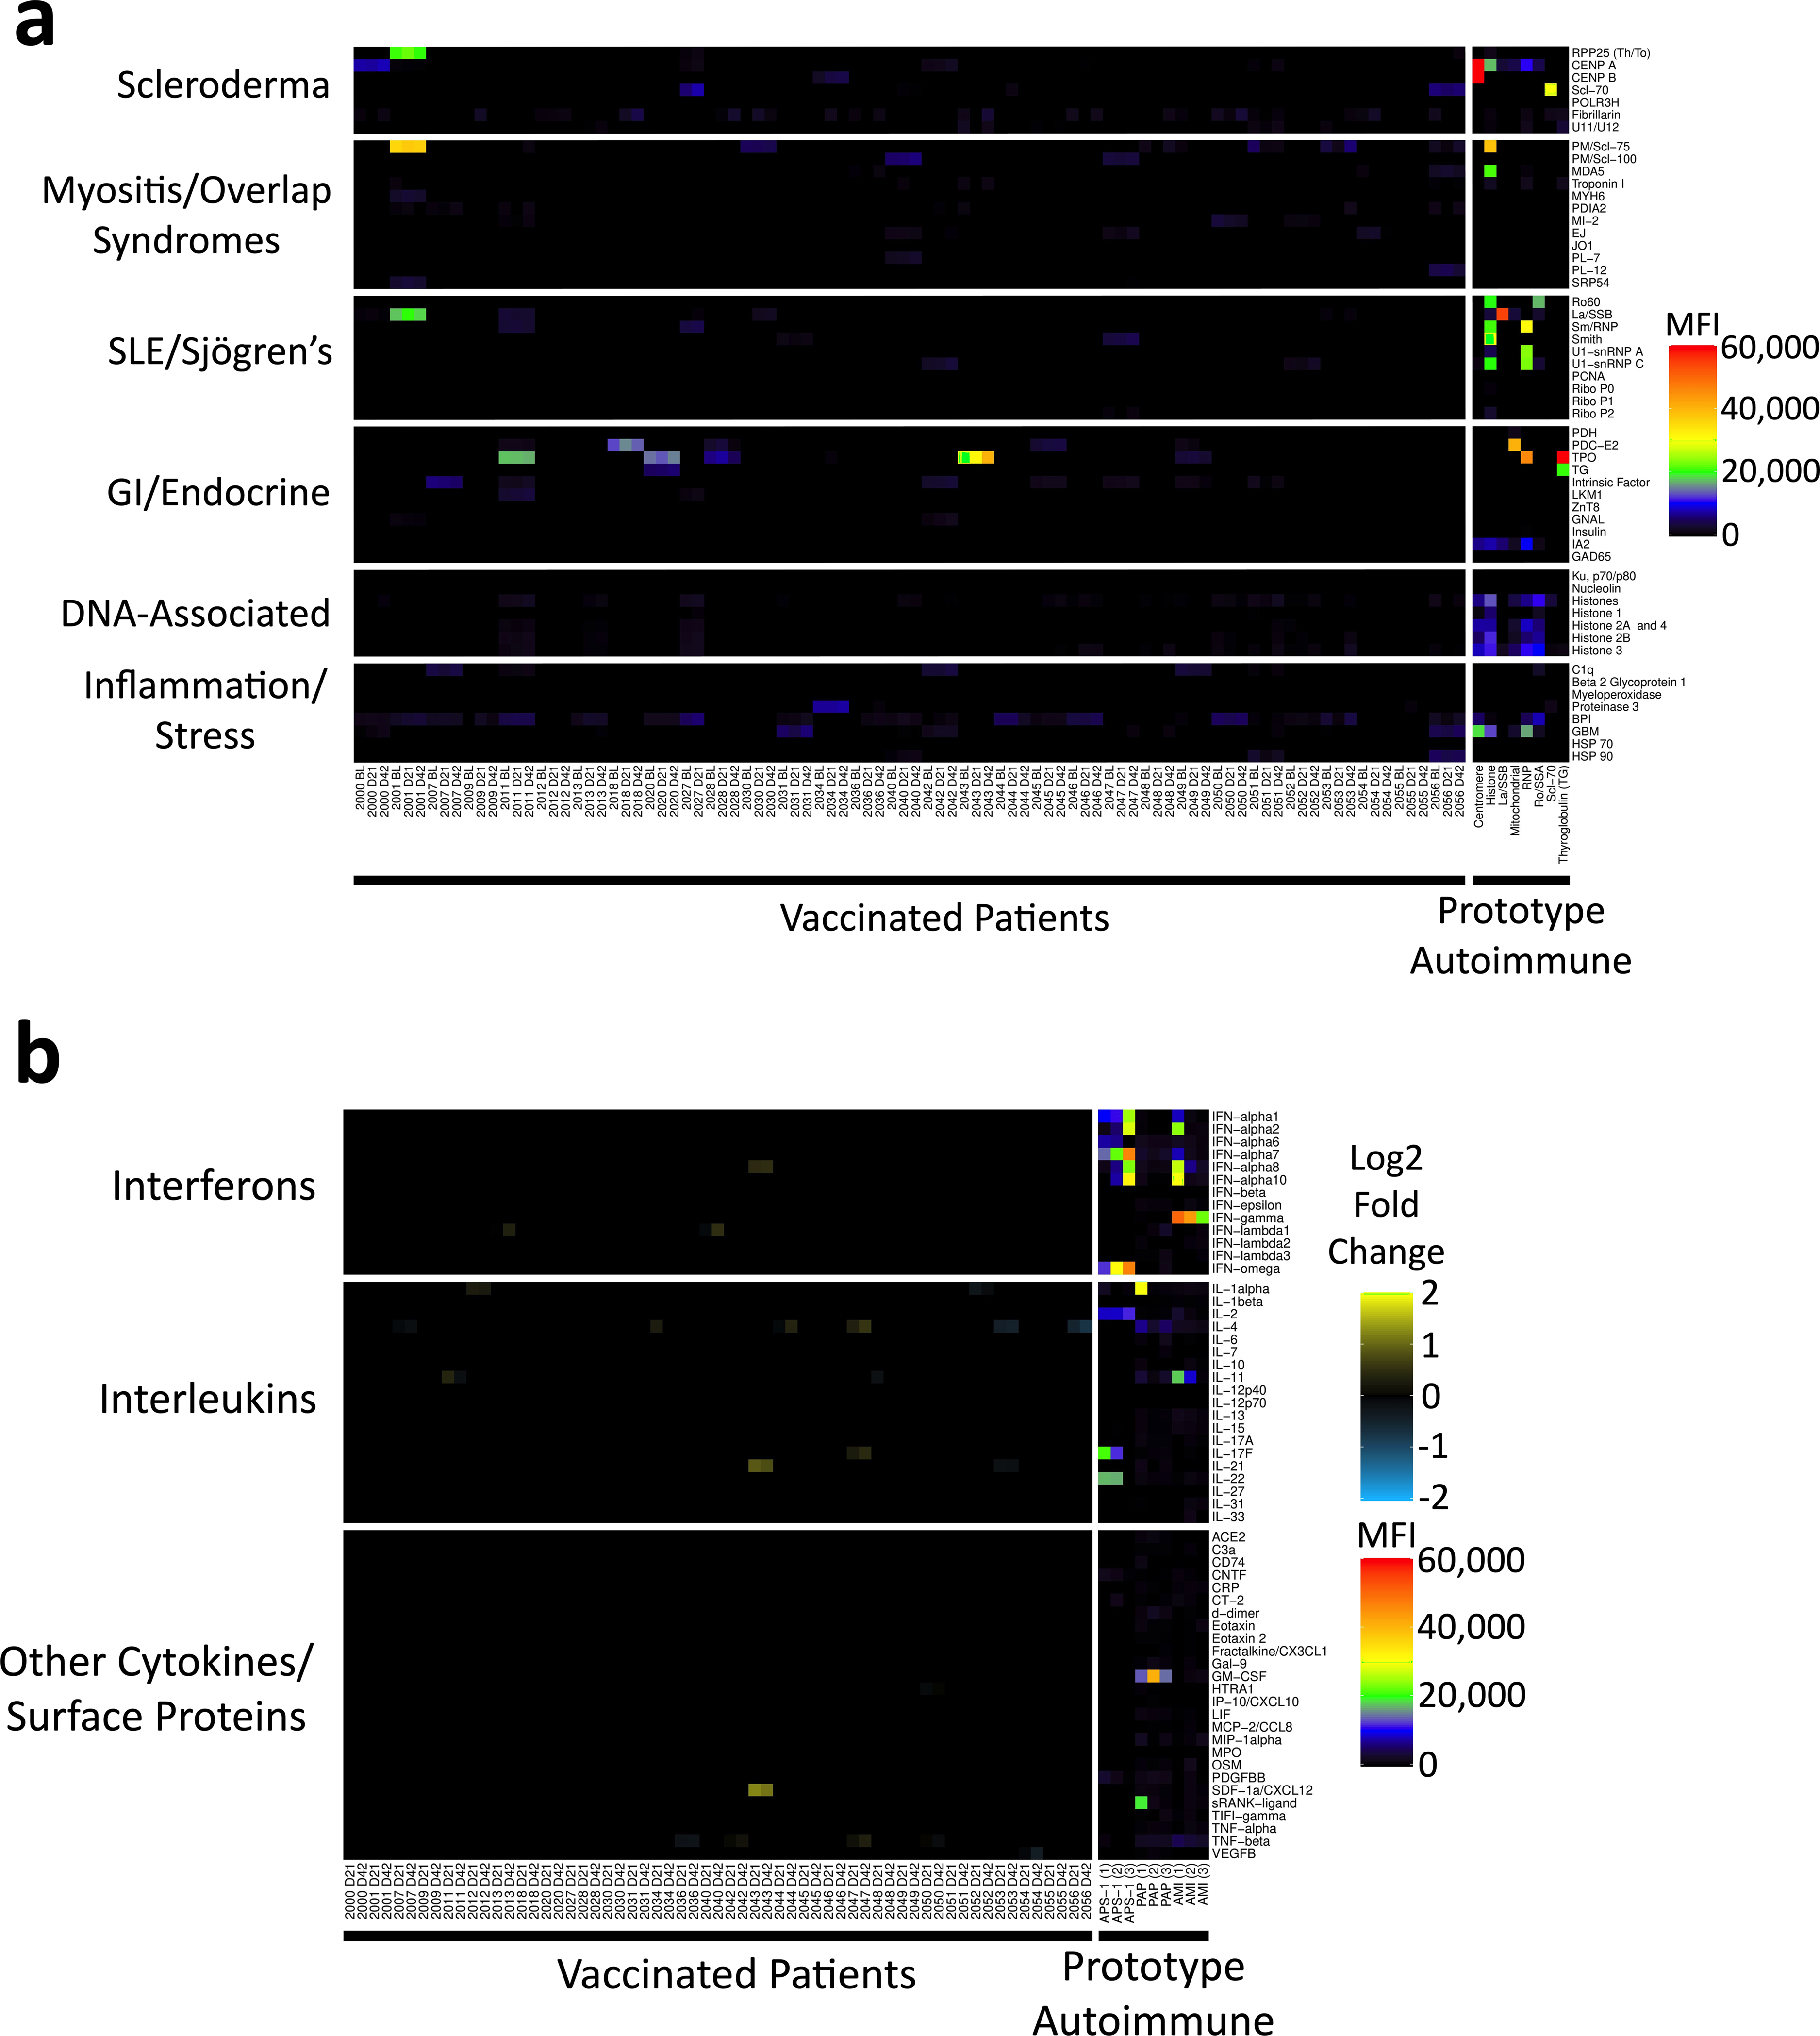
Extended Data Fig. 3 |. Autoantibodies and anticytokine antibodies in vaccinated individuals.

a, Heat map depicting serum IgG antibodies discovered using a 55-plex bead-based protein array containing the indicated autoantigens (y axis). Autoantigens are grouped on the basis of disease (for example, scleroderma, myositis and overlap syndromes such as mixed connective tissue disease, systemic lupus erythematosus (SLE) and Sjögren’s, and gastrointestinal and endocrine disorders), DNA-associated antigens and antigens associated with tissue inflammation or stress responses. Vaccinated individuals are shown on the left (n = 30 individuals, on day 0, day 21, and day 42 and n = 1 on day 0 and day 21), and eight prototype autoimmune disorders are shown on the right. Colours correspond to the MFI values shown at far right. b, Heat map using a 58-plex array of cytokines, chemokines, growth factors and receptors. Cytokines are grouped on the y axis by category (interferons, interleukins and other cytokines, growth factors and receptors), and serum samples are shown on the x axis. Vaccinated individuals are shown on the left (n = 30 individuals, on day 0, day 21 and day 42 and n = 1 on day 0 and day 21). Data are displayed as fold change over baseline. Prototype samples from patients with immunodeficiency disorders are shown on the right, and include three patients with AMI, three patients with PAP and three patients with APS1. Colours for the prototype samples correspond to the MFI values shown at far right.
