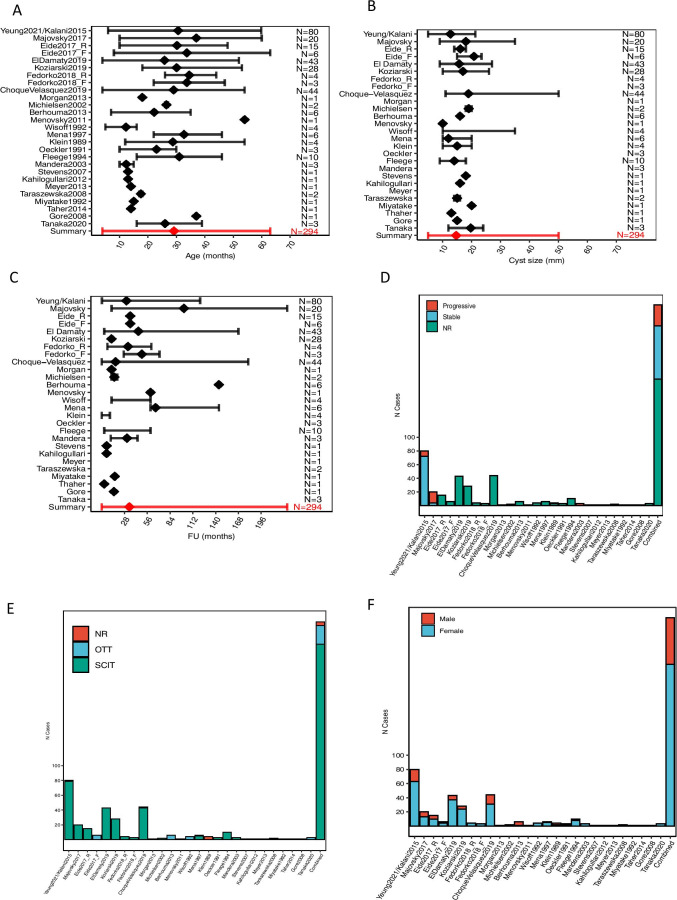
Fig. 3.
Summary of cohort characteristics. A Age at the time of operation. B Cyst size at the time of operation. C Duration of post-operative follow-up. D Symptom progression pre-operatively. E Surgical approach. F Gender at the time of operation. Forest plots report mean (diamonds) ± max/min (error bars). The absence of a diamond or error bars indicate that the information was not available for that study. In all graphs, the final entry represents a summary of all the available data. Yeung2021/Kalani2015 have been grouped together as Kalani’s case series [23] is fully contained within Yeung’s case series [46]. The figure is available in colour online. SCIT, SupraCerebellar Infra-Tentorial approach; OTT, occipital trans-tentorial approach; NR, not reported

