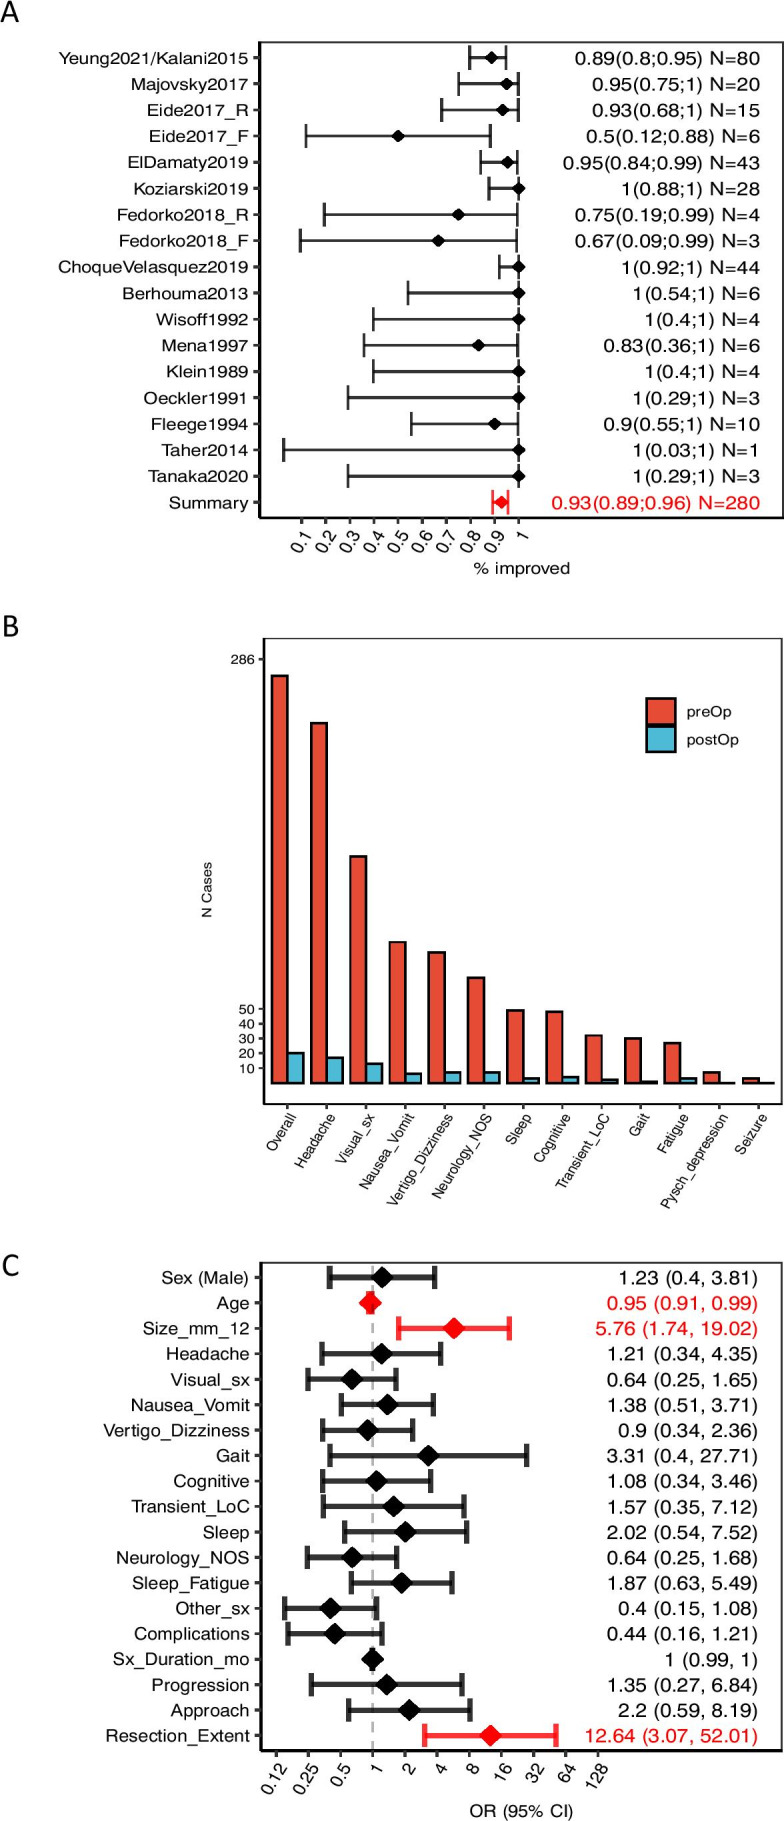
Fig. 5.

Summary of the efficacy profile of surgical management for nhSPC. A Improvement rate for each study and overall cohort. Data shown as mean (diamonds) ± 95% CI (error bars). Eide2017_R refers to the patients of Eide’s cohort that were managed by resection, while Eide2017_F refers to those managed by fenestration. Analogously, Fedorko2018_R refers to the patients in Fedorko’s series that were managed by resection, and Fedorko2018_F to those managed by fenestration. B Proportion of patients presenting with each symptom pre-operatively (red bars), and proportion of patients who did not improve post-operatively (blue bar). C Association between presenting characteristics and post-operative improvement, quantified by univariate logistic regression. Data shown as OR (diamonds) ± 95% CI. Statistically significant associations are shown in red. OR > 1 indicates that the characteristic is associated with better outcomes, while OR < 1 indicates an association with worse outcomes. Raw data is available as scatterplots in Supplementary Fig. 6. In all cases, improvement is defined as reduced symptom-related burden, where both pre-existing and any newly acquired symptoms following surgery are considered. Only data from consecutive case series has been included in the outcome analysis. The figure is available in colour online. Size_mm_12, cyst size > 12 mm; Visual_sx, visual symptoms; Neurology_NOS, neurology not otherwise specified; Resection_extent, cyst resection, as opposed to cyst fenestration; Sleep_fatigue: sleep disturbances or fatigue; Pysch_depression, psychiatric symptoms of depression; Other_sx, any of the following symptoms: ‘Cognitive’, ‘Transient_LoC’, ‘Sleep’, ‘Pysch_depression’, ‘Seizure’, ‘Neurology_NOS’, ‘Fatigue’; LoC, loss of consciousness
