
Fig. 1:
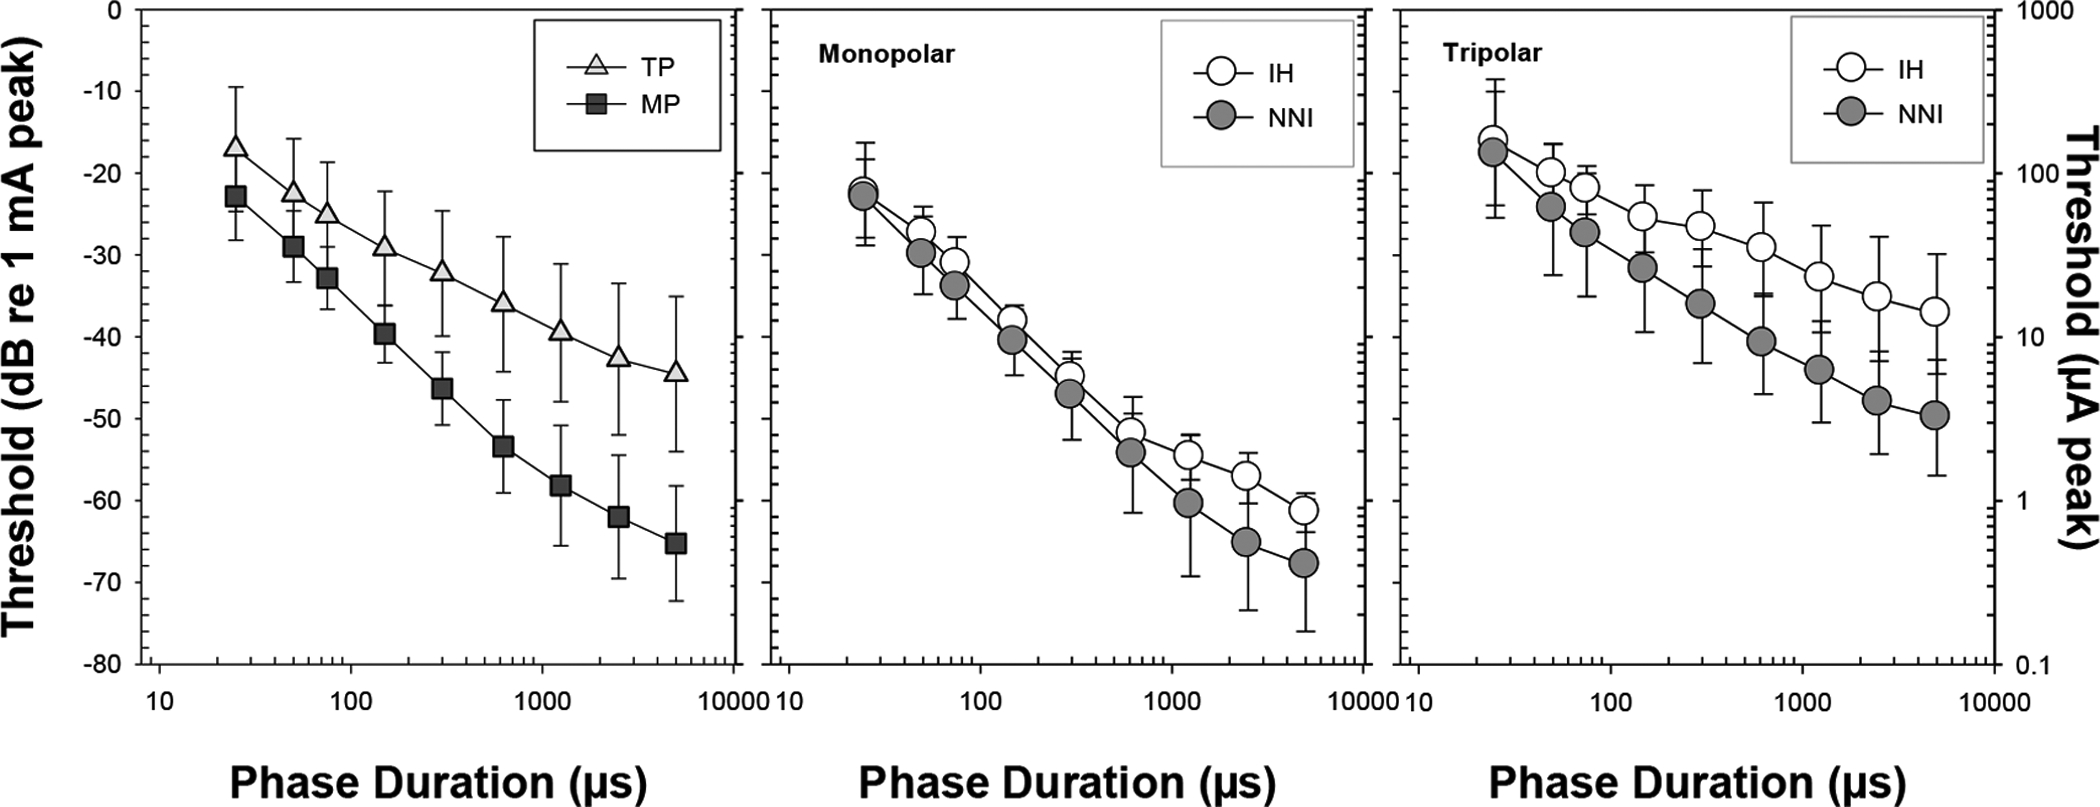
Average thresholds for all animals for the different phase durations (±1SD) are shown for each electrode configuration (left panel) with the main effect of treatment group collapsed. Group average thresholds (±1SD) are shown for MP (middle panel) and TP (right panel) electrode configurations; the open symbols represent the IH group (n=10) and the filled symbols represent the NNI treatment group (n=14).