
Fig. 3:
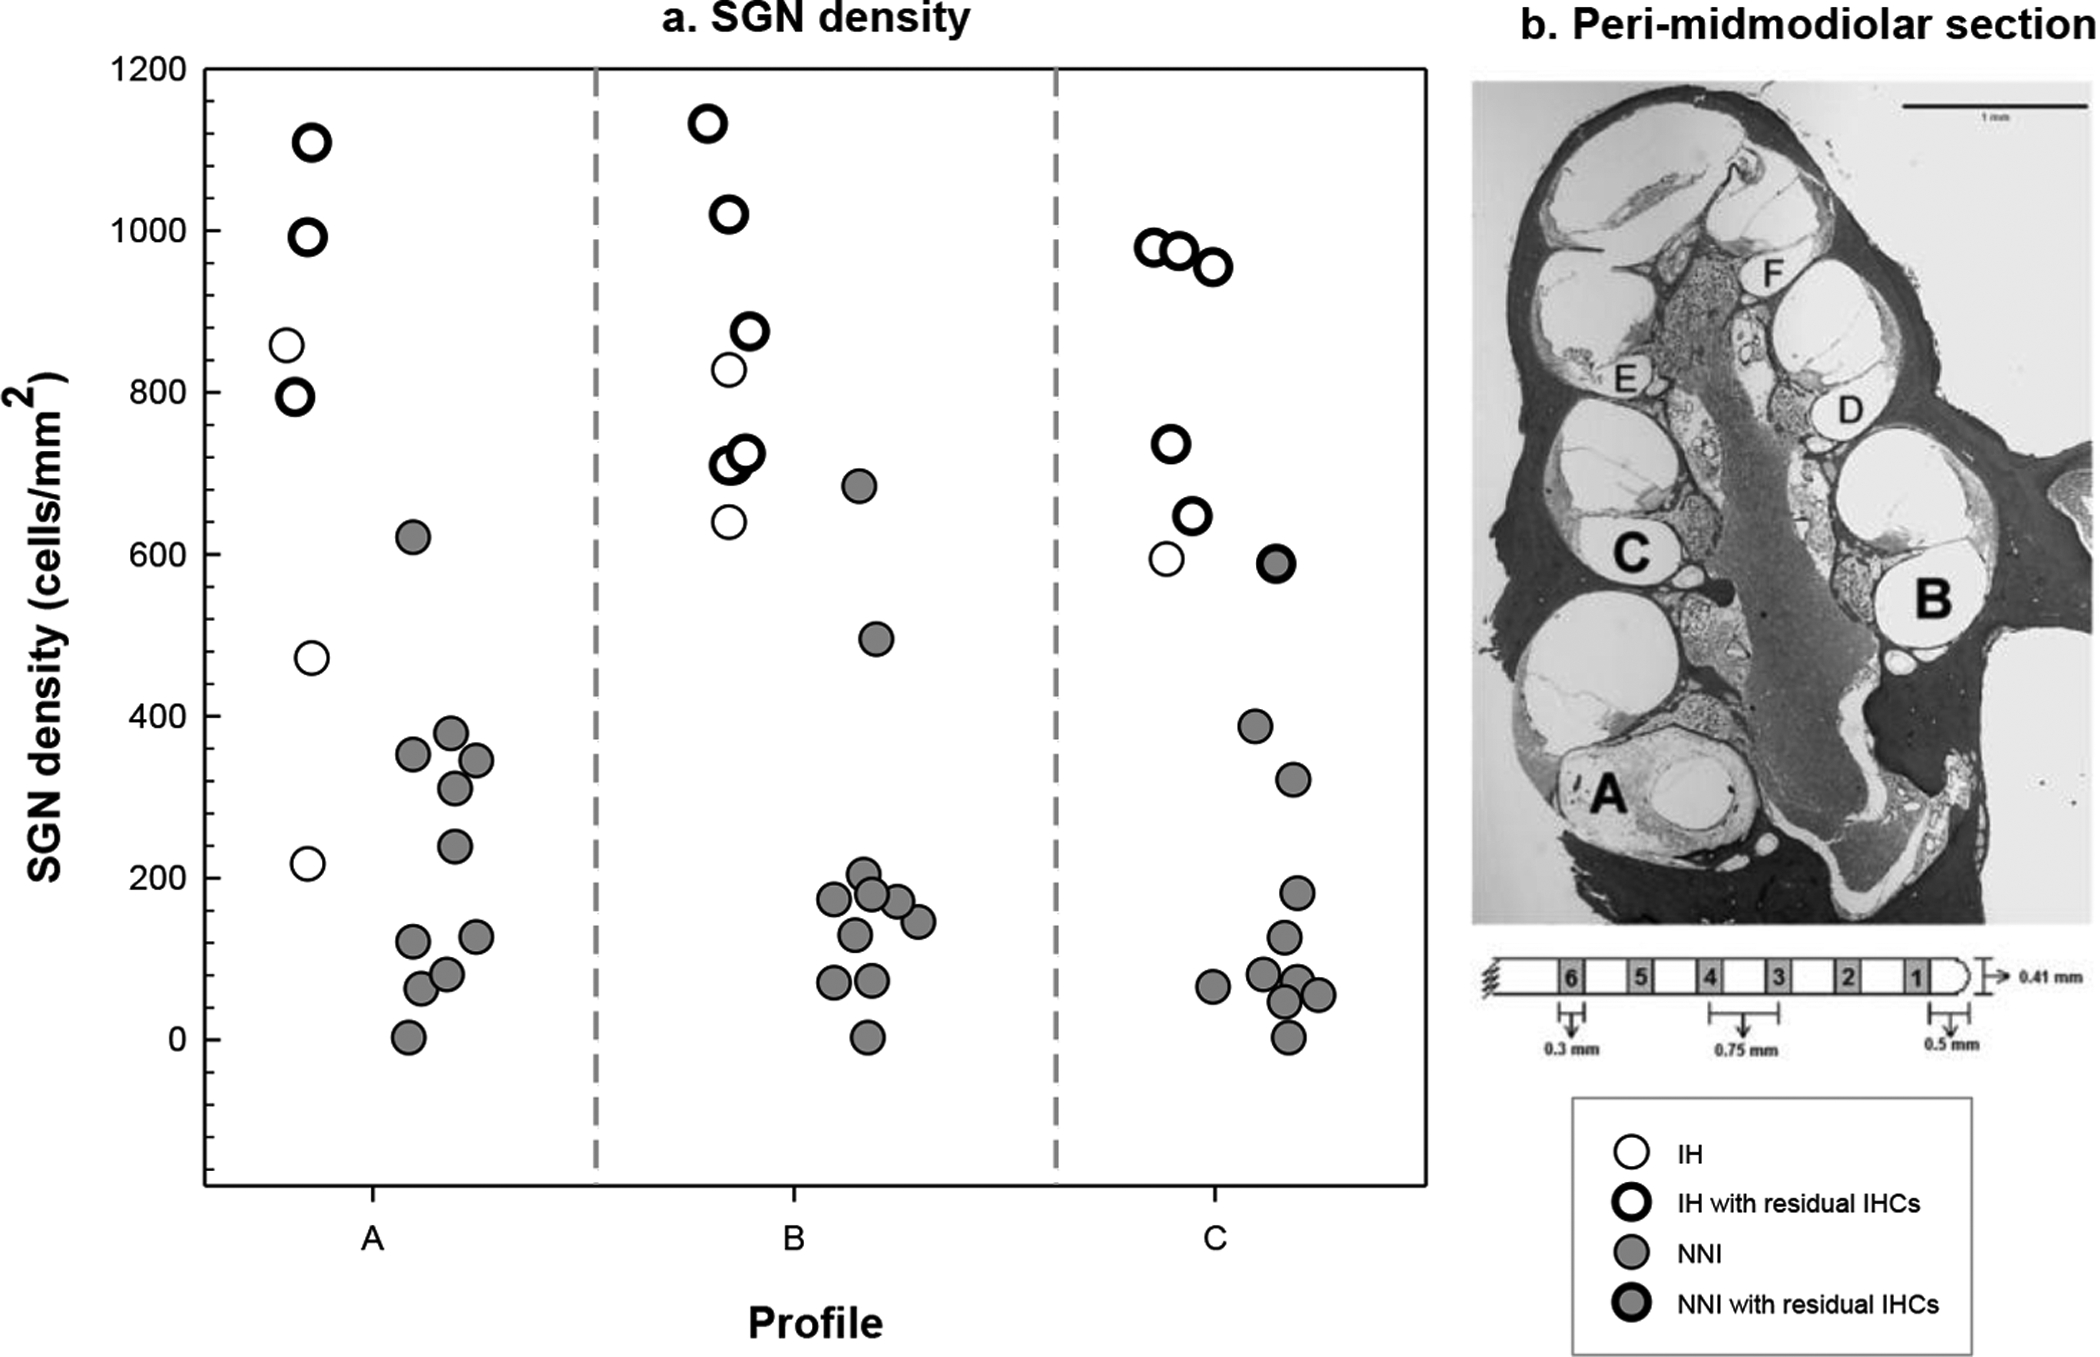
a) Density of SGN (profiles A, B, and C) are displayed in the left panel for the two groups. Unfilled symbols represent SGN density for the IH group (N = 7) and filled symbols represent those for the NNI group (N = 11). Bold symbols represent animals with residual IHC survival. Symbols are jittered across the x-axis to avoid overlap. b) The right panel displays a peri-midmodiolar section of a guinea pig cochlea demonstrating the labeling of Rosenthal’s canal for reporting histological results (Pfingst et al., 2017). The profiles are labeled as A through F in basal to apical direction. An eight-electrode array was used. The primary electrode for stimulation was electrode 2. This section was taken at the location of the primary electrode used for stimulation which was located in the vicinity of profile A for banded electrodes and profile B for half-banded electrodes. In this particular example, the implant location can be seen from the circular tract left in the tissue in profile A.