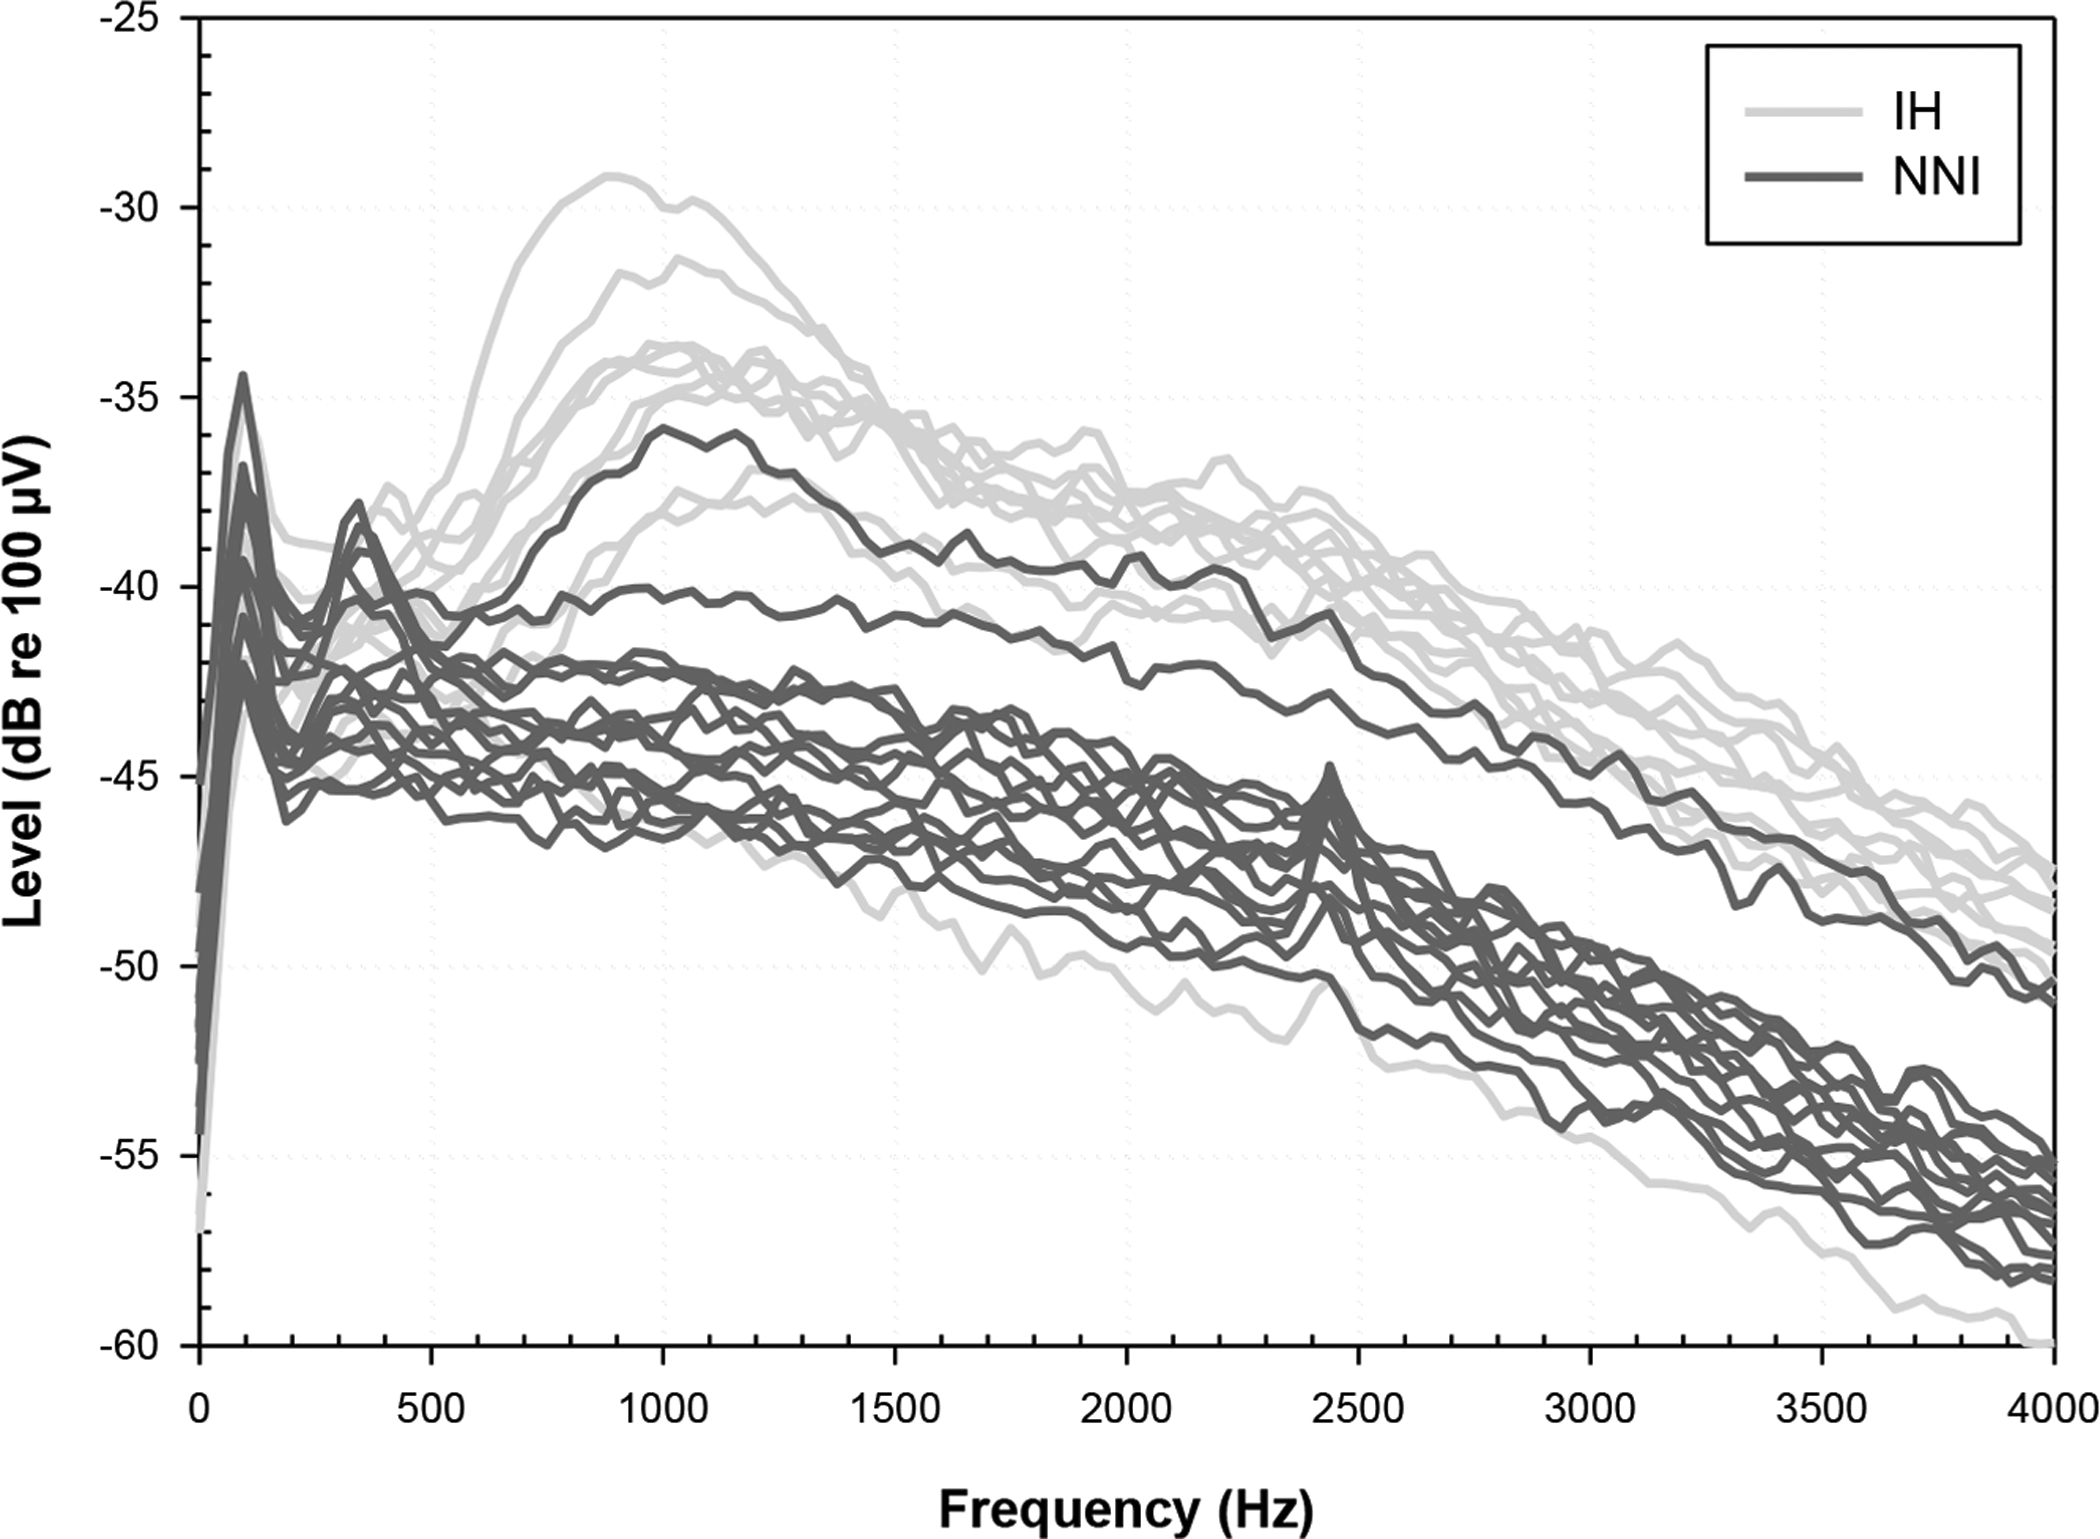
Fig. 4:

ESA recordings are displayed for the IH (N = 10; light gray traces) and NNI (N = 14; dark gray traces) groups. Spectra from the IH group, in all but one animal, demonstrate peaks between 900 and 1000 Hz suggesting spontaneous firing of the auditory nerve; the one IH animal with no peak had low IHC survival and implant issues on the day of euthanasia. Spectra from the NNI group show no peak with the exception of one animal who had residual apical IHCs.
