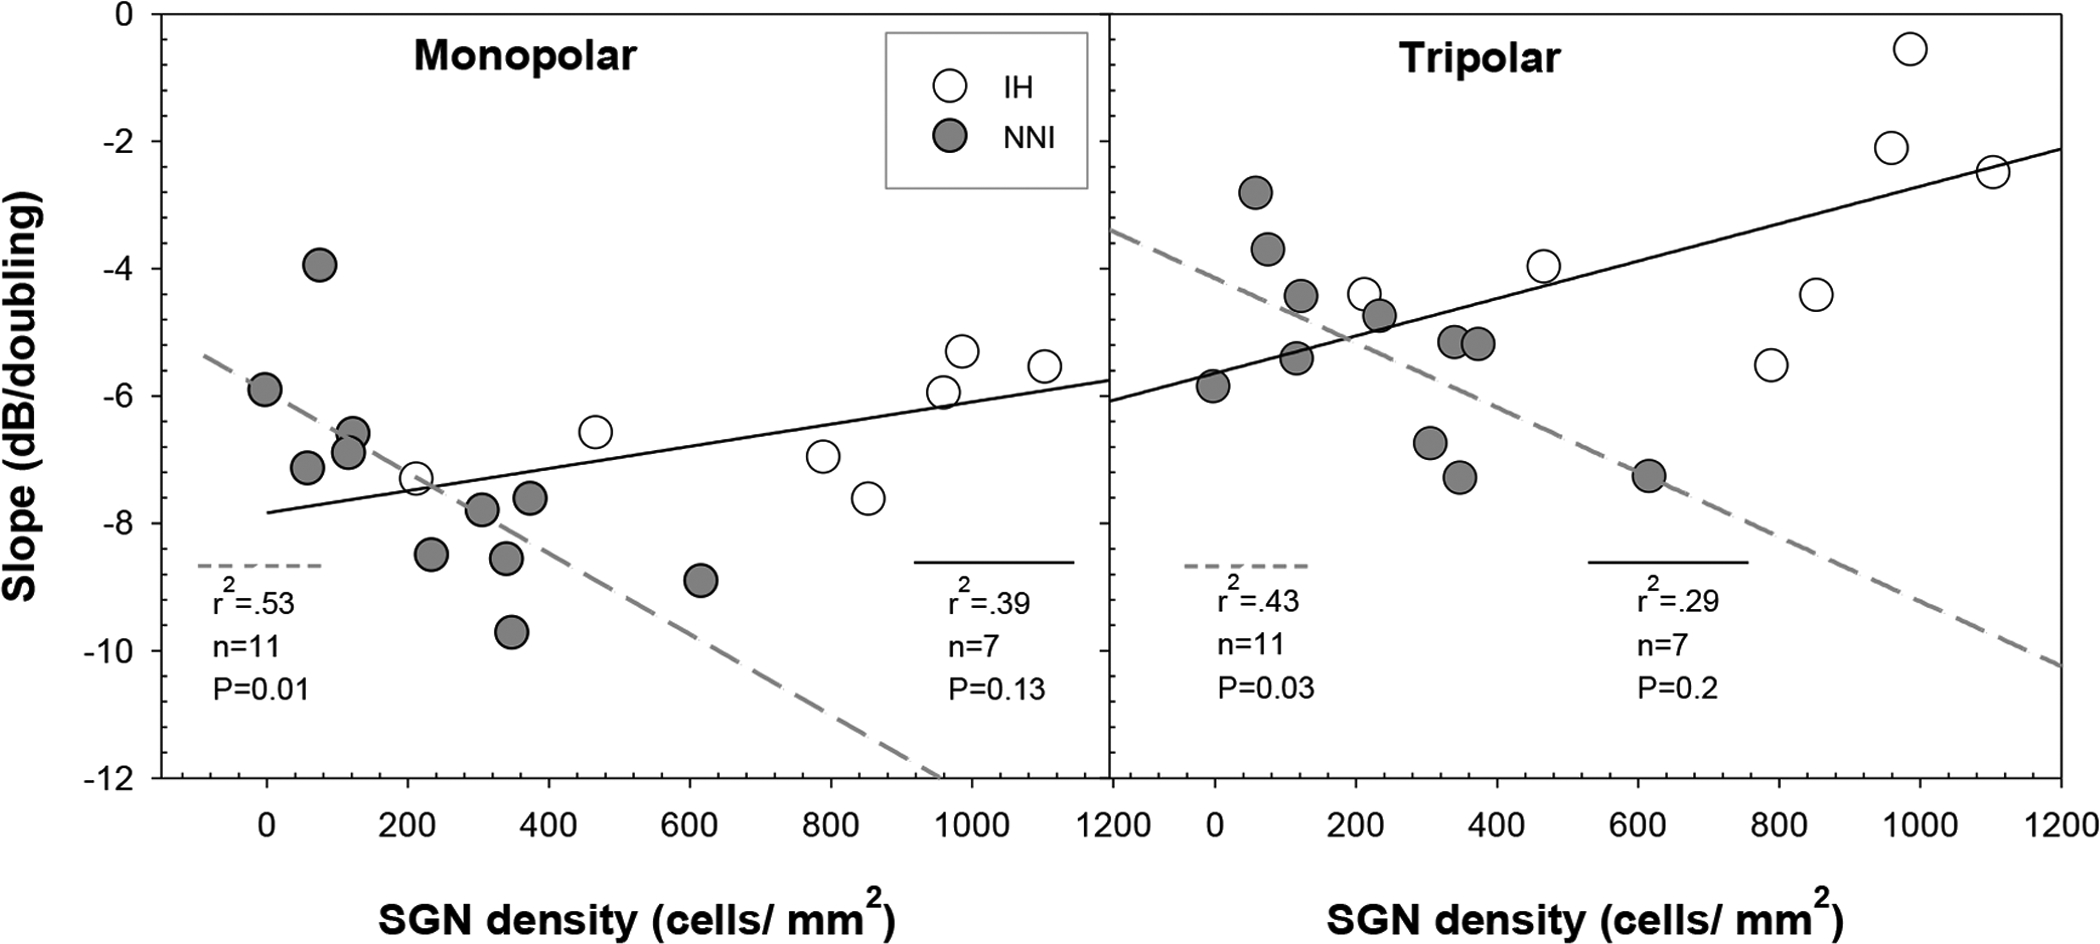
Fig. 5:

The correlation between SGN-A density (cells/mm2) and strength-duration function slopes for the IH (N = 7; unfilled symbols; solid lines) and the NNI (N = 11; filled symbols; dashed lines) groups are shown for MP (left panel) and TP (right panel) electrode configurations. The relationship between SGN-A density and strength-duration function slope was significant using both MP and TP stimulation modes in the NNI group but not in the IH group.
