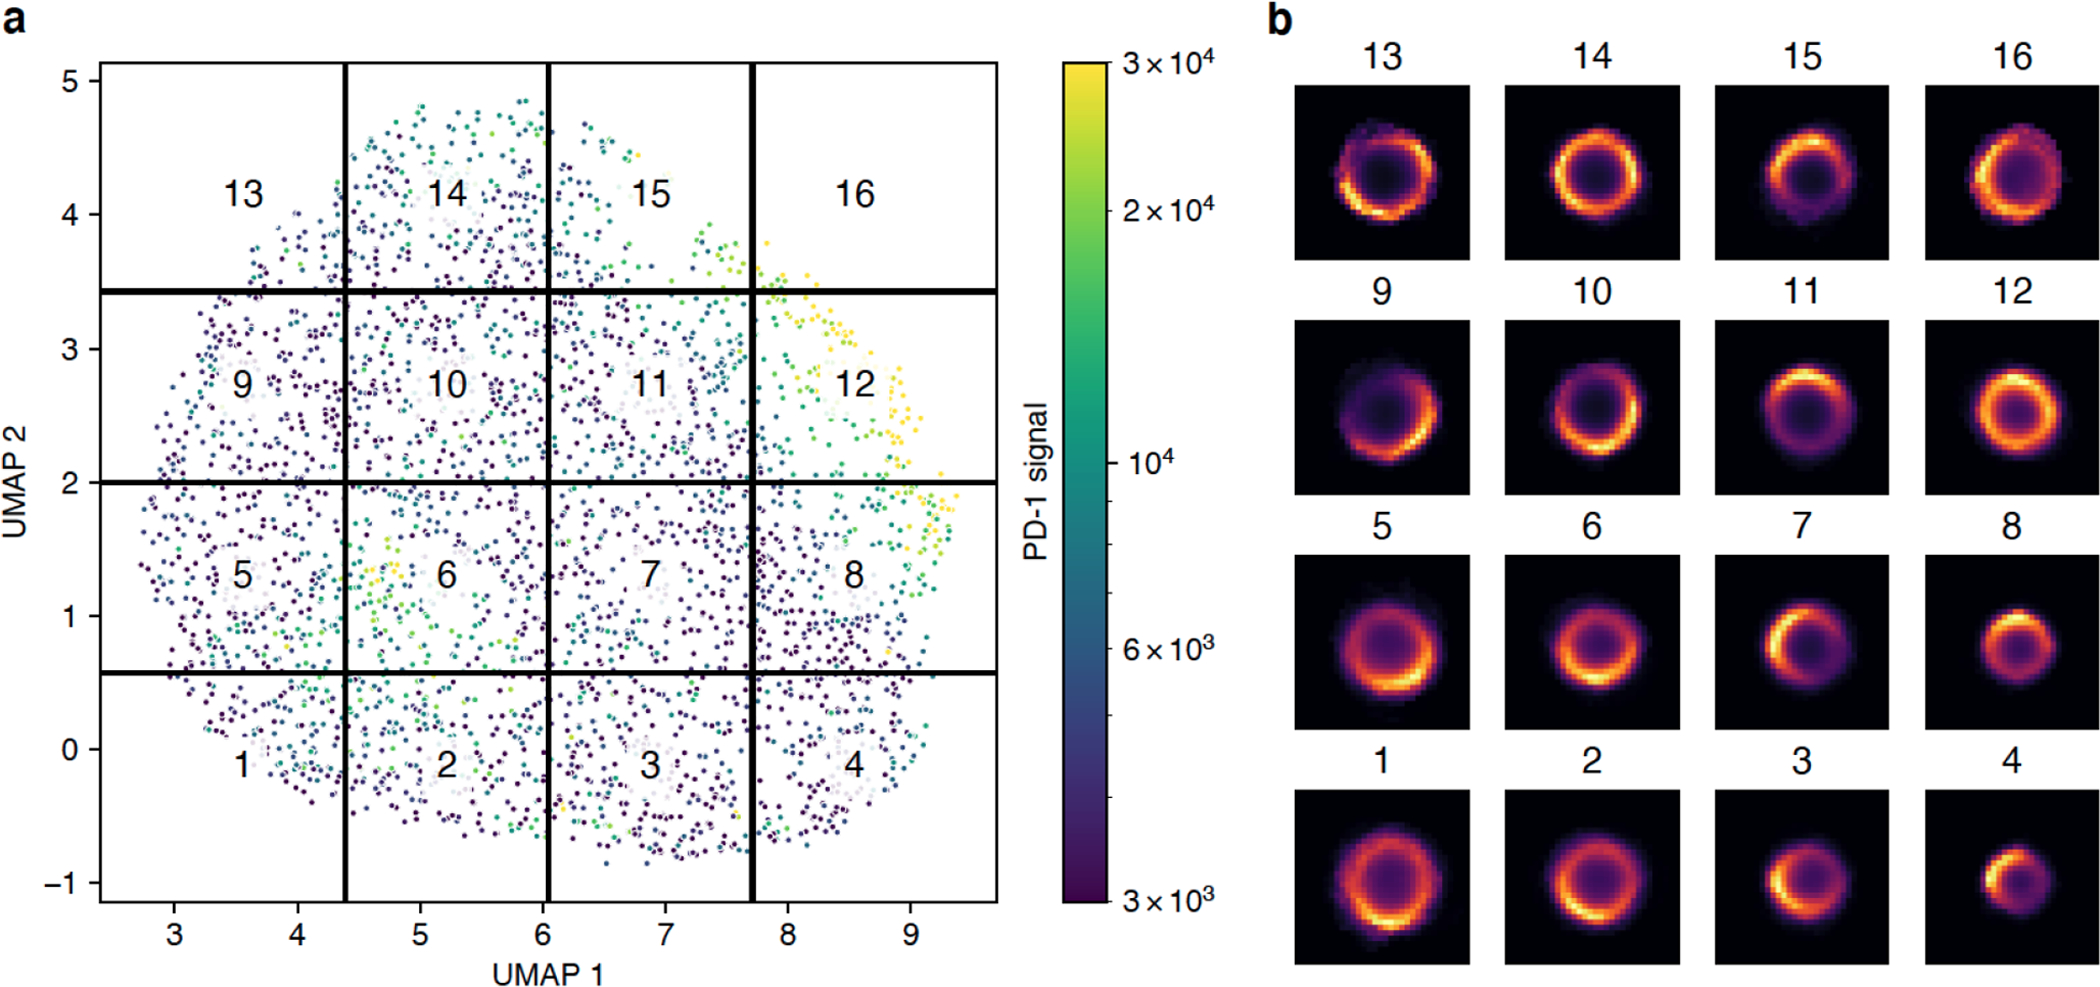
Figure 3: Spatial distribution of PD-1 classified using a variational autoencoder.

a) UMAP embedding of the latent space produced by the autoencoder. Cropped images of cells stained for PD-1 were used to train a convolutional autoencoder with a bottleneck size of eight. The latent representation of all cells was further reduced using UMAP. Each point in the plot represents a single cell colored by the mean intensity of the PD-1 signal. The UMAP space was evenly divided into 16 regions. b) Mean spatial signal of PD-1 across all cells contained within each region.
