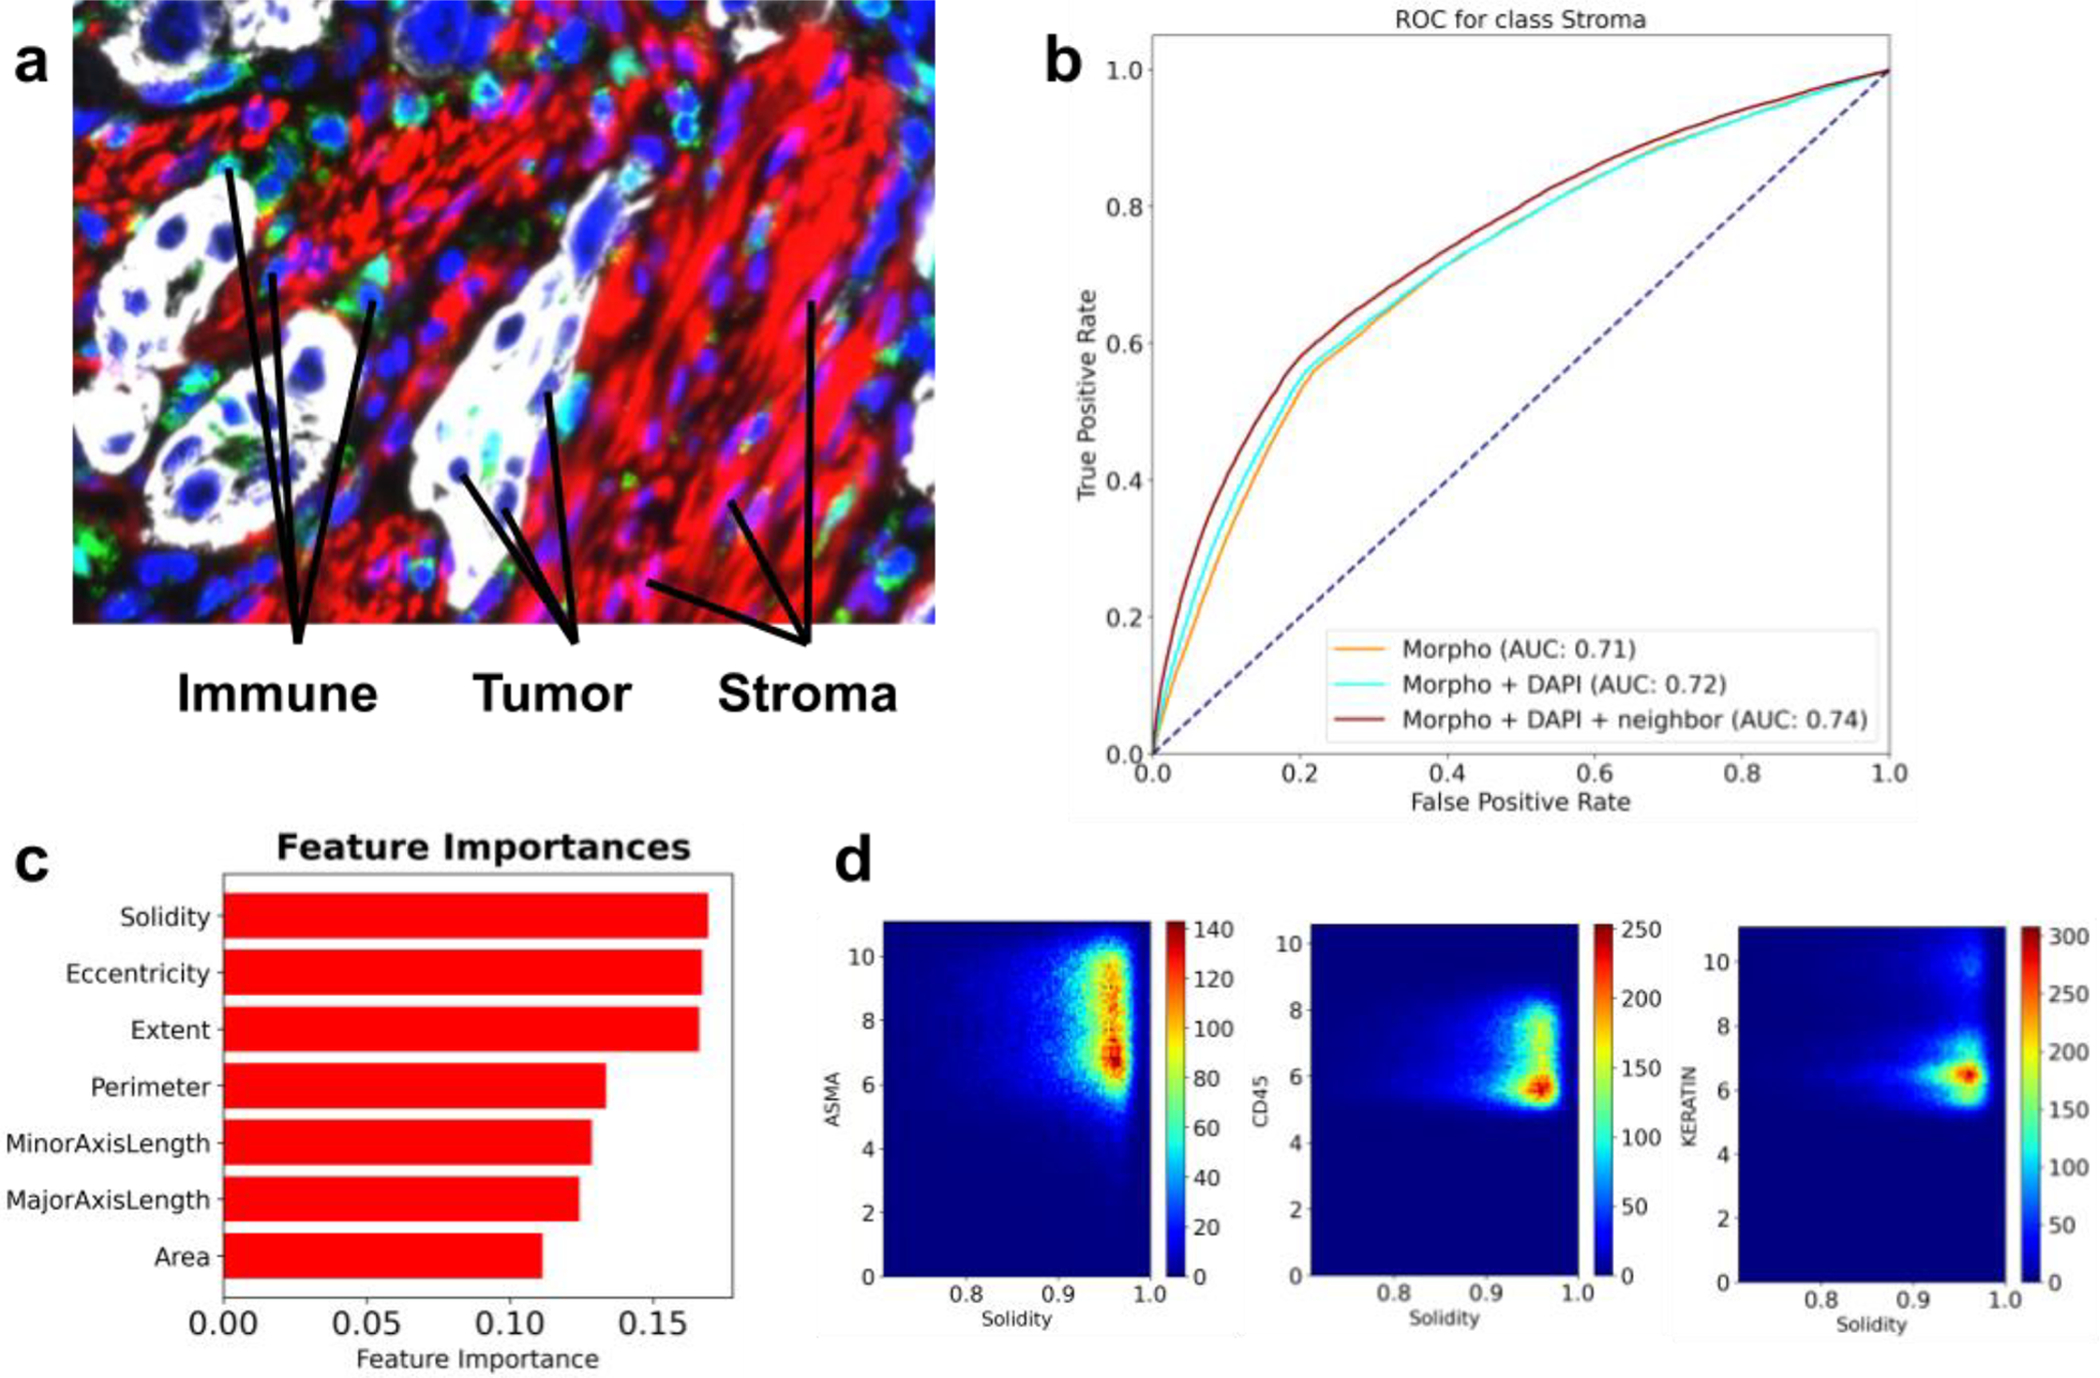
Figure 4: A summary of the morphotype challenge.

a) A representative image of a lung cancer specimen, stained for Keratin (white), CD45 (green), IBA1 (cyan) and alpha-SMA (red). b) ROC curves associated with predictors trained to recognize stromal cells from morphological features only (yellow), morphological features and the intensity of the DAPI stain (cyan), and all of the above computed for the index cell and its closest five neighbors (brown). c) Top features identified through feature importance scores computed by gradient boosted random forests. d) Density scatter plots showing how solidity varies with markers of stromal (alpha-SMA), immune (CD45) and tumor (Keratin) cells.
