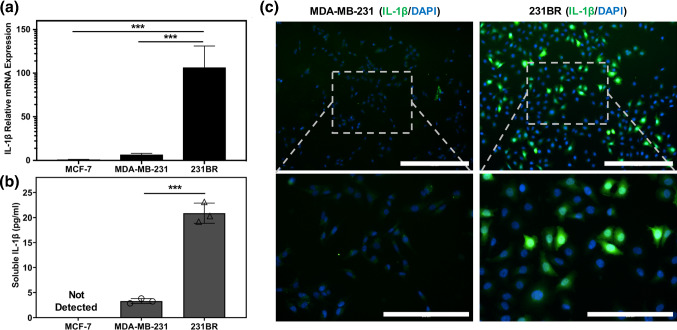
Figure 1.
IL-1β expression is highly upregulated in brain-seeking TNBC cells. (a) Gene expression analysis of IL1B in MCF-7, MDA-MB-231, and 231BR cells, showing higher expression in 231BR cells compared to MDA-MB-231 and MCF-7 cells. ***p < 0.001, calculated by ordinary one-way ANOVA with Tukey's multiple comparisons test. (b) ELISA assay quantification of soluble IL-1β secreted by MCF-7, MDA-MB-231, and 231BR cells. ***p < 0.001 (unpaired t test). Each data point represents the concentration of IL-1β in a technical replicate. Results are representative of two independent experiments. Error bars represent standard deviation in (a, b). (c) Immunocytochemistry of IL-1β showing substantially higher expression in a subset of 231BR cells compared to MDA-MB-231 cells. Lower row images are higher magnifications of the indicated rectangular region in the top row images. Scale bars indicate 400 μm in the top row images and 200 μm in the bottom row images.

