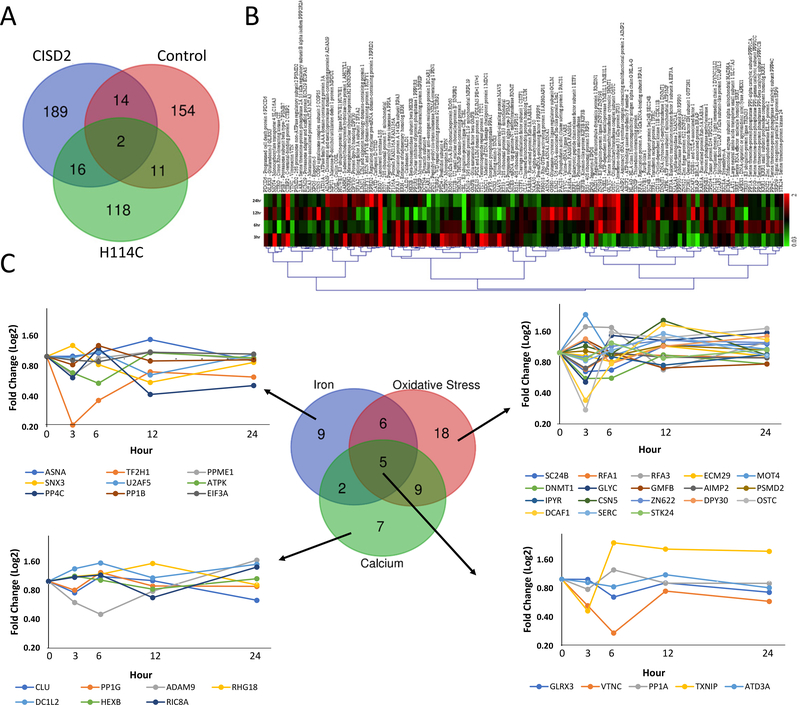
Figure 5.
Time-course proteomics analysis of Control-, CISD2- and H114C-expressing cells following application of Doxycycline (DOX; 2μg/ml) for 0, 3, 6, 12, and 24 hours. A. Venn diagram showing the overlap between proteins significantly altered in their expression in Control, CISD2 and H114C cells upon treatment with DOX (2μg/ml) for 0, 3, 6, 12 and 24 hours. B. Heatmap showing the expression pattern of the 118 proteins uniquely expressed following the application of DOX (2μg/ml) for 0, 3, 6, 12, and 24 hours to H114C cells. C. Venn diagram and line graphs showing the expression pattern of iron-, oxidative stress- and calcium- response proteins in H114C cells following the application of DOX (2μg/ml). Please see Supplementary Tables S1–S6, Supplementary Figure 3, and text for additional details. All proteins shown were found to be significantly expressed (P<0.05; N=3) compared to time 0 hour by a one-way Welch ANOVA.

