Fig. 1.
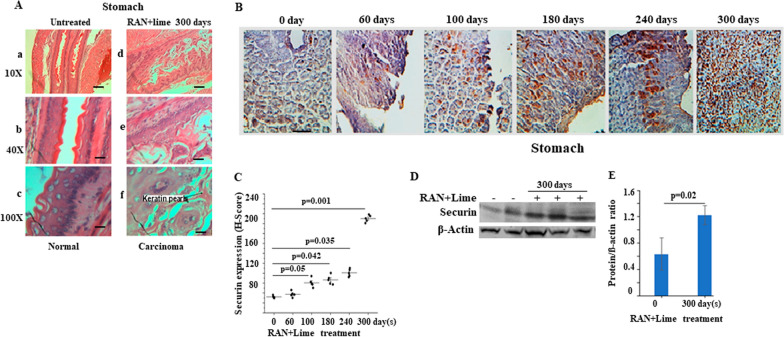
Expression analysis of the mouse PTTG1/securin gene in both normal and tumor tissues following treatment with RAN + lime. A Histopathology of untreated normal and tumorous stomach of mice following RAN + lime treatment for 300 days (scale bars: 200 µm). Carcinoma shows squamous keratin pearls. The magnification is indicated as 10X, 40X and 100X. B Immunohistochemical images of mouse stomach treated with RAN + lime for various durations. Normal expression of the securin gene in the untreated control and gradual upregulation of securin expression in treated samples for different time periods are shown. The magnification of all these images is × 40 and the scale bar: 200 µm. The expression level of securin in untreated and treated mice was analysed by H-score and is shown as the mean H-score ± SEM in (C). D Representative western blotting detection of securin and ß-actin in mouse stomach cells after exposure to RAN + lime for 0 and 300 days. E Quantitative densitometric analysis of the level of proteins of the genes mentioned in (D). The values are the mean ± SEM of the number of individuals used in this experiment. The values were normalized to the respective ß-actin values. In both C and E, the P values are shown compared with the untreated control (as determined by paired t-test). P values less than 0.05 are considered significant

