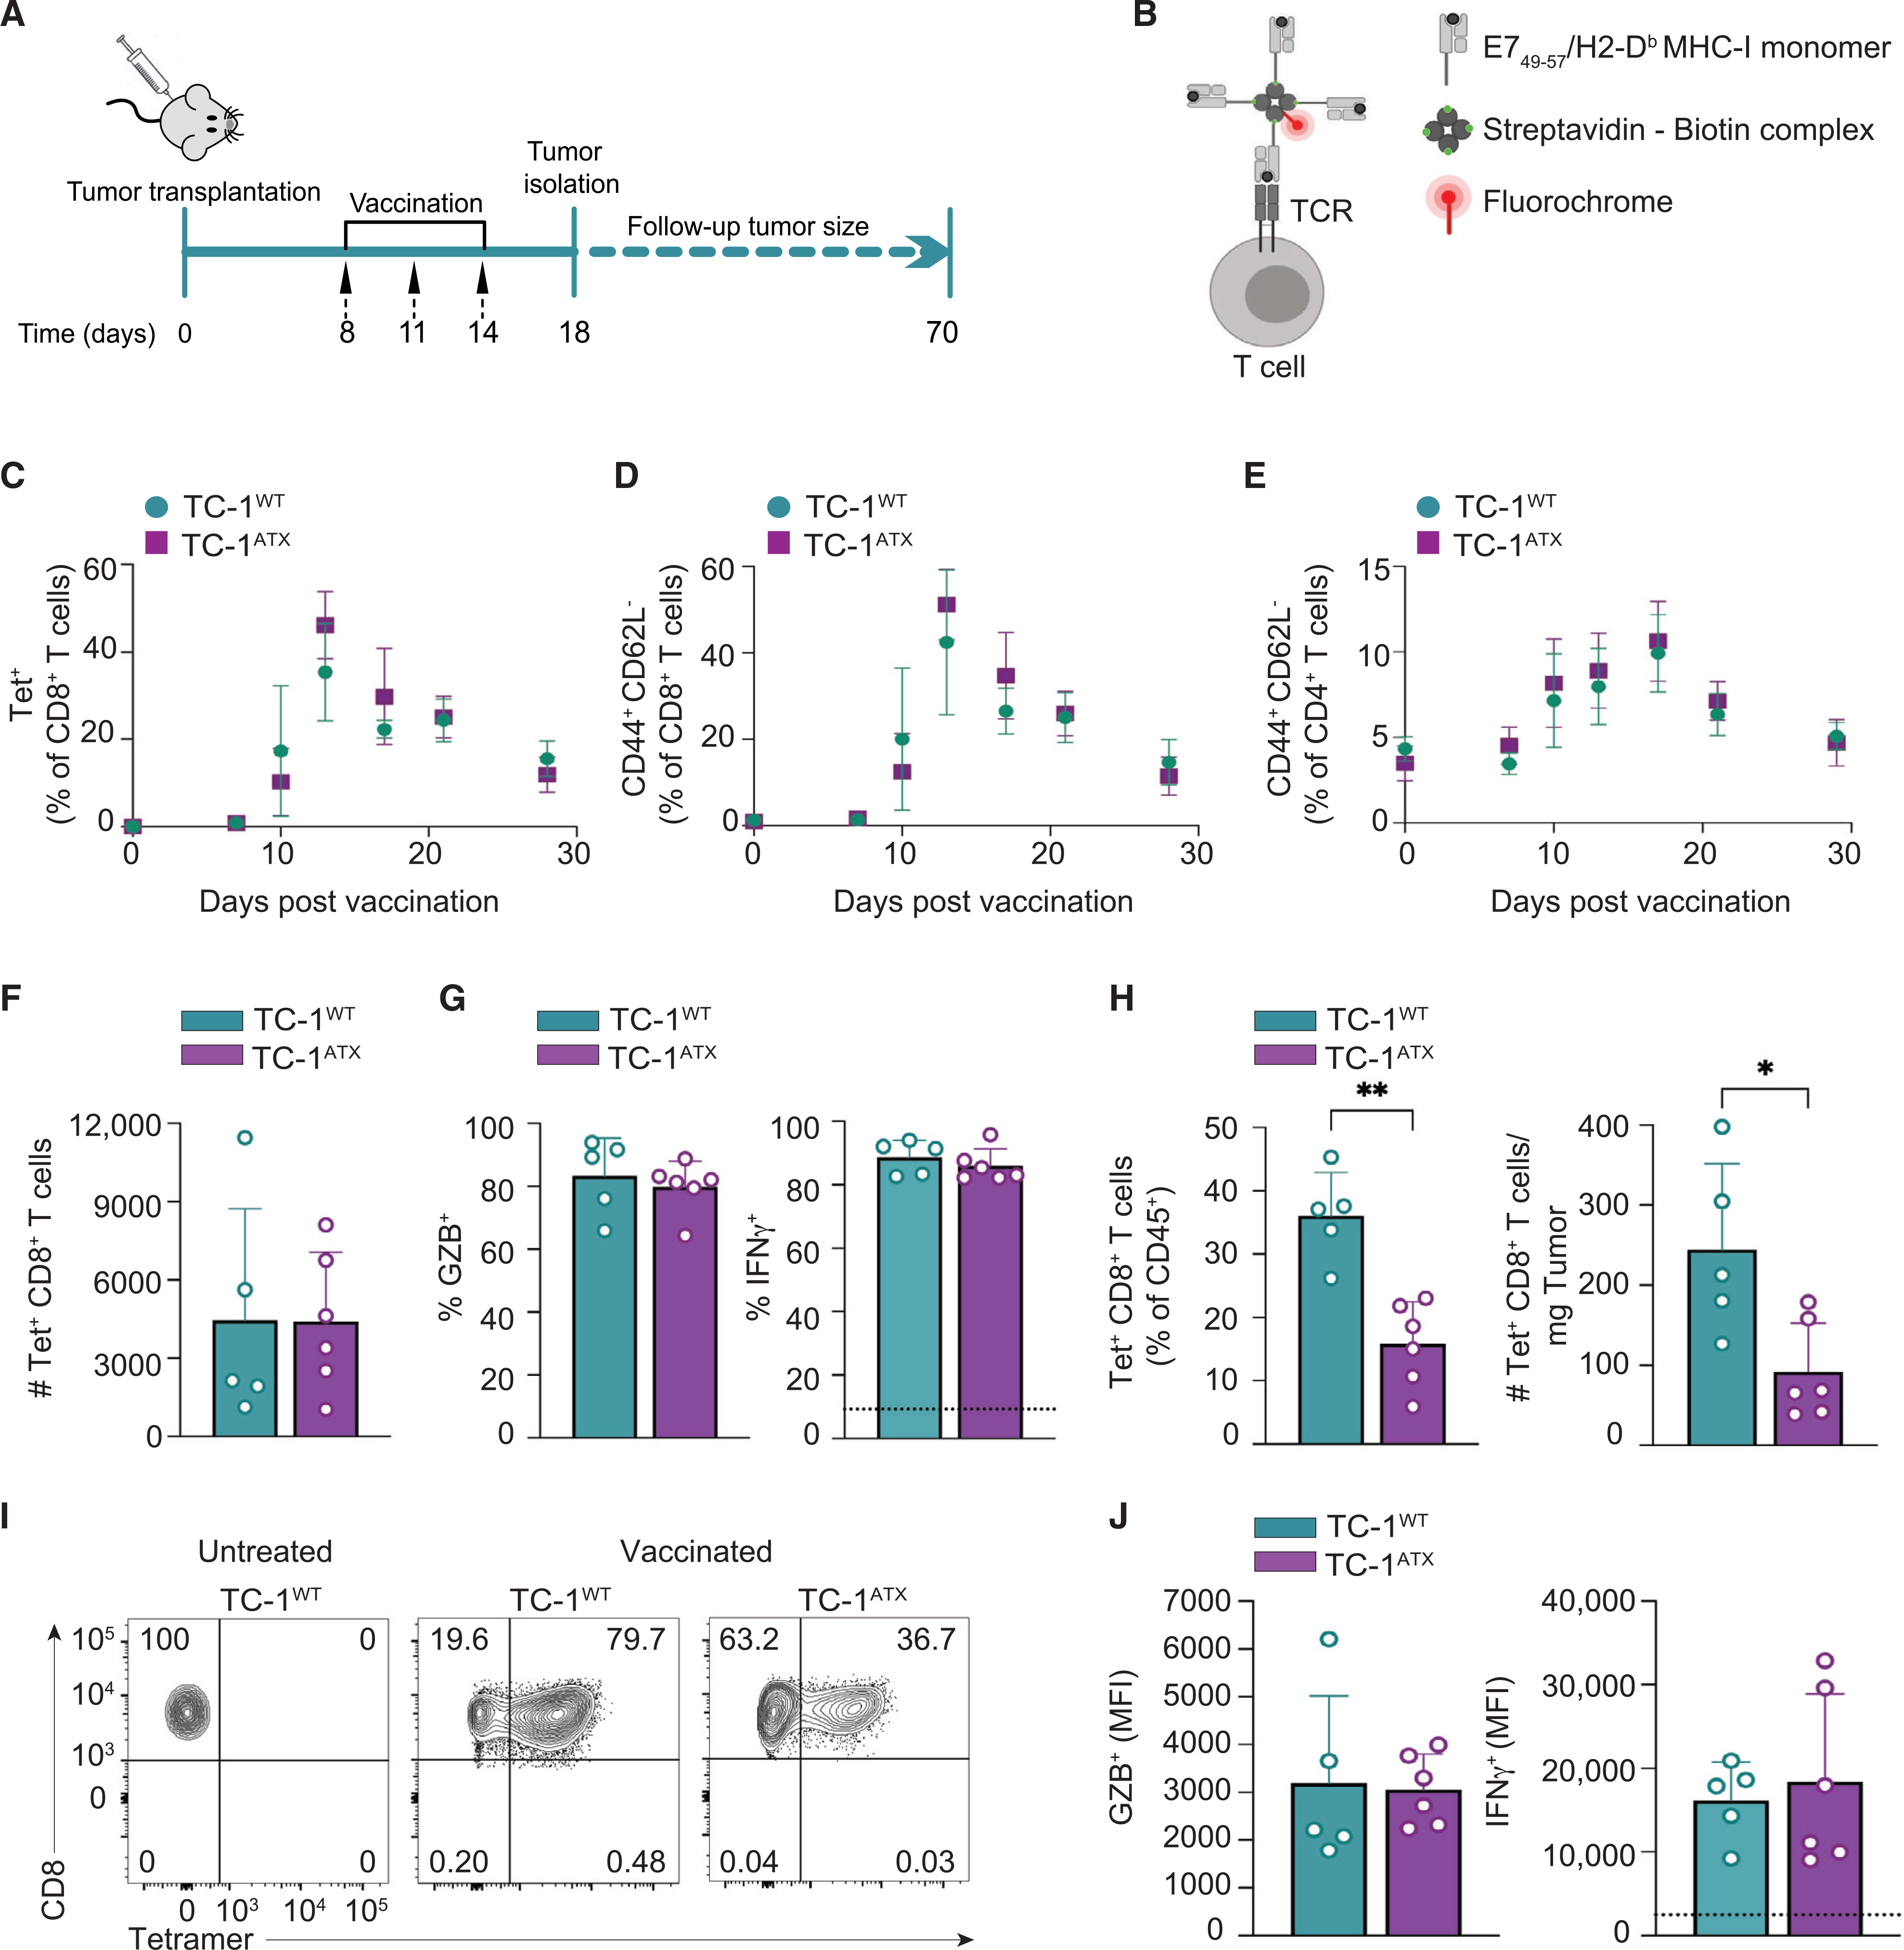
Figure 5. Enforced ATX expression in tumor cells does not affect induction of T cell responses by vaccination.

(A) Experimental set-up in the anti-cancer vaccination model. Mice were injected s.c. with wild-type (TC-1WT) or ATX-expressing (TC-1ATX) tumor cells on day 0, vaccinated on days 8, 11, and 14 and were either sacrificed on day 18, or monitored until day 70. Tumor cells were injected into one flank and the vaccine DNA was “tattooed” into the depilated skin of the opposing flank. Data are from one experiment representative of two experiments.
(B) The DNA vaccine encodes HPV-E7 protein together with tumor-unrelated helper epitopes. The CD8+ T cells that have a TCR specific for the immunodominant E749–57 peptide presented in H-2Db can be detected with MHC class I (MHC-I) tetramers. A tetramer is made by folding E749–57 peptide with MHC-I monomer, conjugating this to biotin and multimerizing it with fluorochrome-conjugated streptavidin.
(C–E) Monitoring of the T cell response to vaccination in peripheral blood by flow cytometry in TC-1WT (n = 6) and TC-1ATX (n = 5) tumor-bearing mice.
(C) Frequency of H-2Db/E749–57 tetramer positive (Tet+) cells among total CD8+ T cells. (D and E) Frequency of cells with a CD44+CD62L− effector phenotype among total CD8+ T cells (D) or total CD4+ T cells (E).
(F–J) Analysis of the CD8+ T cell response in spleen (F–J) and tumor (H and J) on day 18 in TC-1WT (n = 5) and TC-1ATX (n = 6) tumor-bearing mice.
(F) Absolute number of tetramer positive (Tet+) CD8+ T cells in spleen.
(G) Frequency of granzyme B (GZB)+ and IFNγ+ cells among Tet+ CD8+ T cells in spleen. IFNγ was measured after ex vivo PMA/ionomycin stimulation. The dotted line indicates IFNγ signal in unstimulated cells.
(H) Frequency among CD45+ hematopoietic cells (left) and absolute number (#, right) of Tet+ CD8+ T cells in TC-1WT and TC-1ATX tumors.
(I) Representative flow cytometry plots indicating the percentage of Tet+ cells among total CD8+ T cells in TC-1WT and TC-1ATX tumors after vaccination and in TC-1WT tumors of non-vaccinated (untreated) mice.
(J) Mean fluorescence intensity (MFI) of GZB+ and IFNγ+ cells within Tet+ CD8+ T cells in TC-1WT and TC-1ATX tumors. IFNγ was measured as in (G).
(C–H and J) Data are expressed as mean ± SD; *p < 0.05, **p < 0.01 (Mann-Whitney U test).
