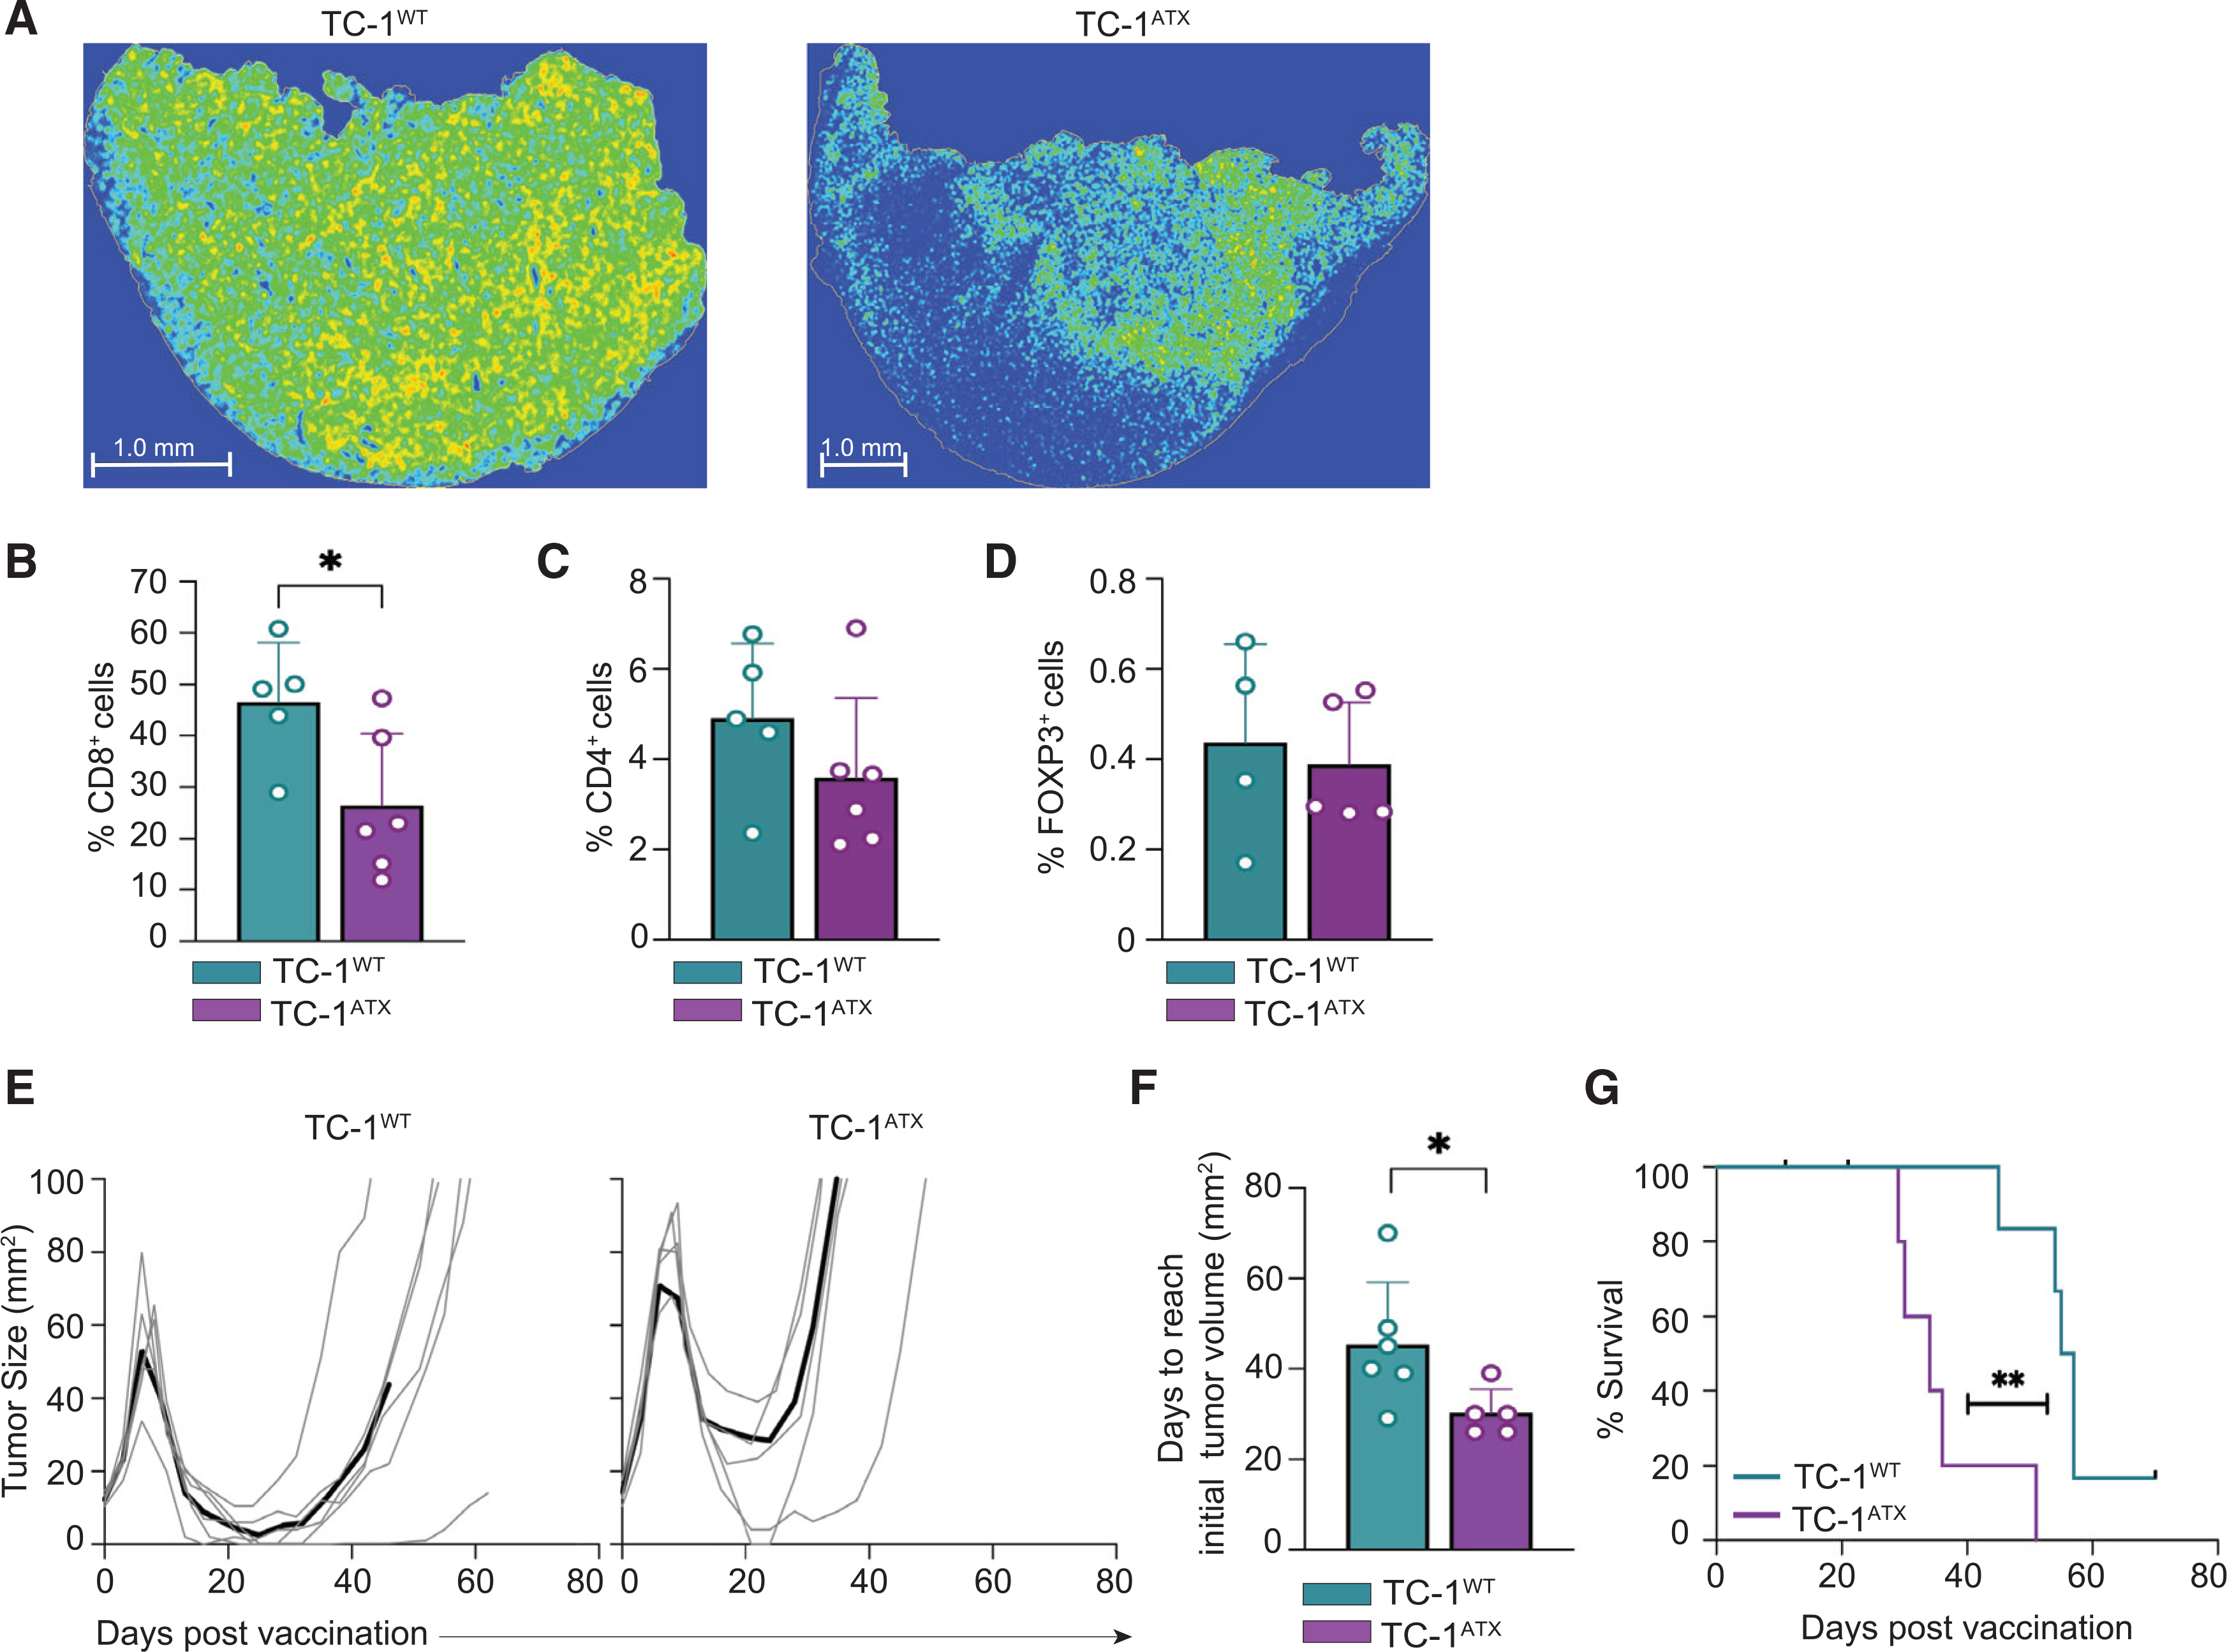
Figure 6. Enforced ATX expression in tumor cells inhibits infiltration of effector CD8+ T cells and impedes vaccine-induced tumor control.

(A–F) Tumor analysis by immunohistochemistry on day 18 in the same mice as analyzed in Figure 5.
(A) Representative heatmaps of CD8+ immunostainings of tumor sections from vaccinated mice bearing TC-1WT or TC-1ATX tumors.
(B–D) Quantification in percentages of CD8+ (B, representative for the data shown in A), CD4+ (C), and FOXP3+ (D) cells out of all nucleated cells as assessed by immunostaining of tumor sections from vaccinated mice bearing TC-1WT or TC-1ATX tumors. Data are depicted as mean + SD, *p < 0.05 (Mann-Whitney U test).
(E–G) TC-1WT (n = 6) and TC-1ATX (n = 5) tumor-bearing mice received vaccination as outlined in Figure 5 and tumor growth was monitored over time up to day 70.
(E) Individual growth curves of TC-1WT and TC-1ATX tumors in vaccinated mice. Black lines represent group average.
(F) Tumor growth delay following vaccination, expressed as number of days required to reach a tumor size corresponding to that at day 7 (see E). Data are depicted as mean + SD, *p < 0.05 (Mann-Whitney U test).
(G) Overall survival curves of tumor-bearing mice. **p < 0.01 (Mantel-Cox analysis).
Data in this figure are from one experiment representative of two independent experiments.
