
Figure 5. Cellular uptake of DiD encapsulated fluorescent sNPs and their lysosomal rupture potential in treated iBMDMs.
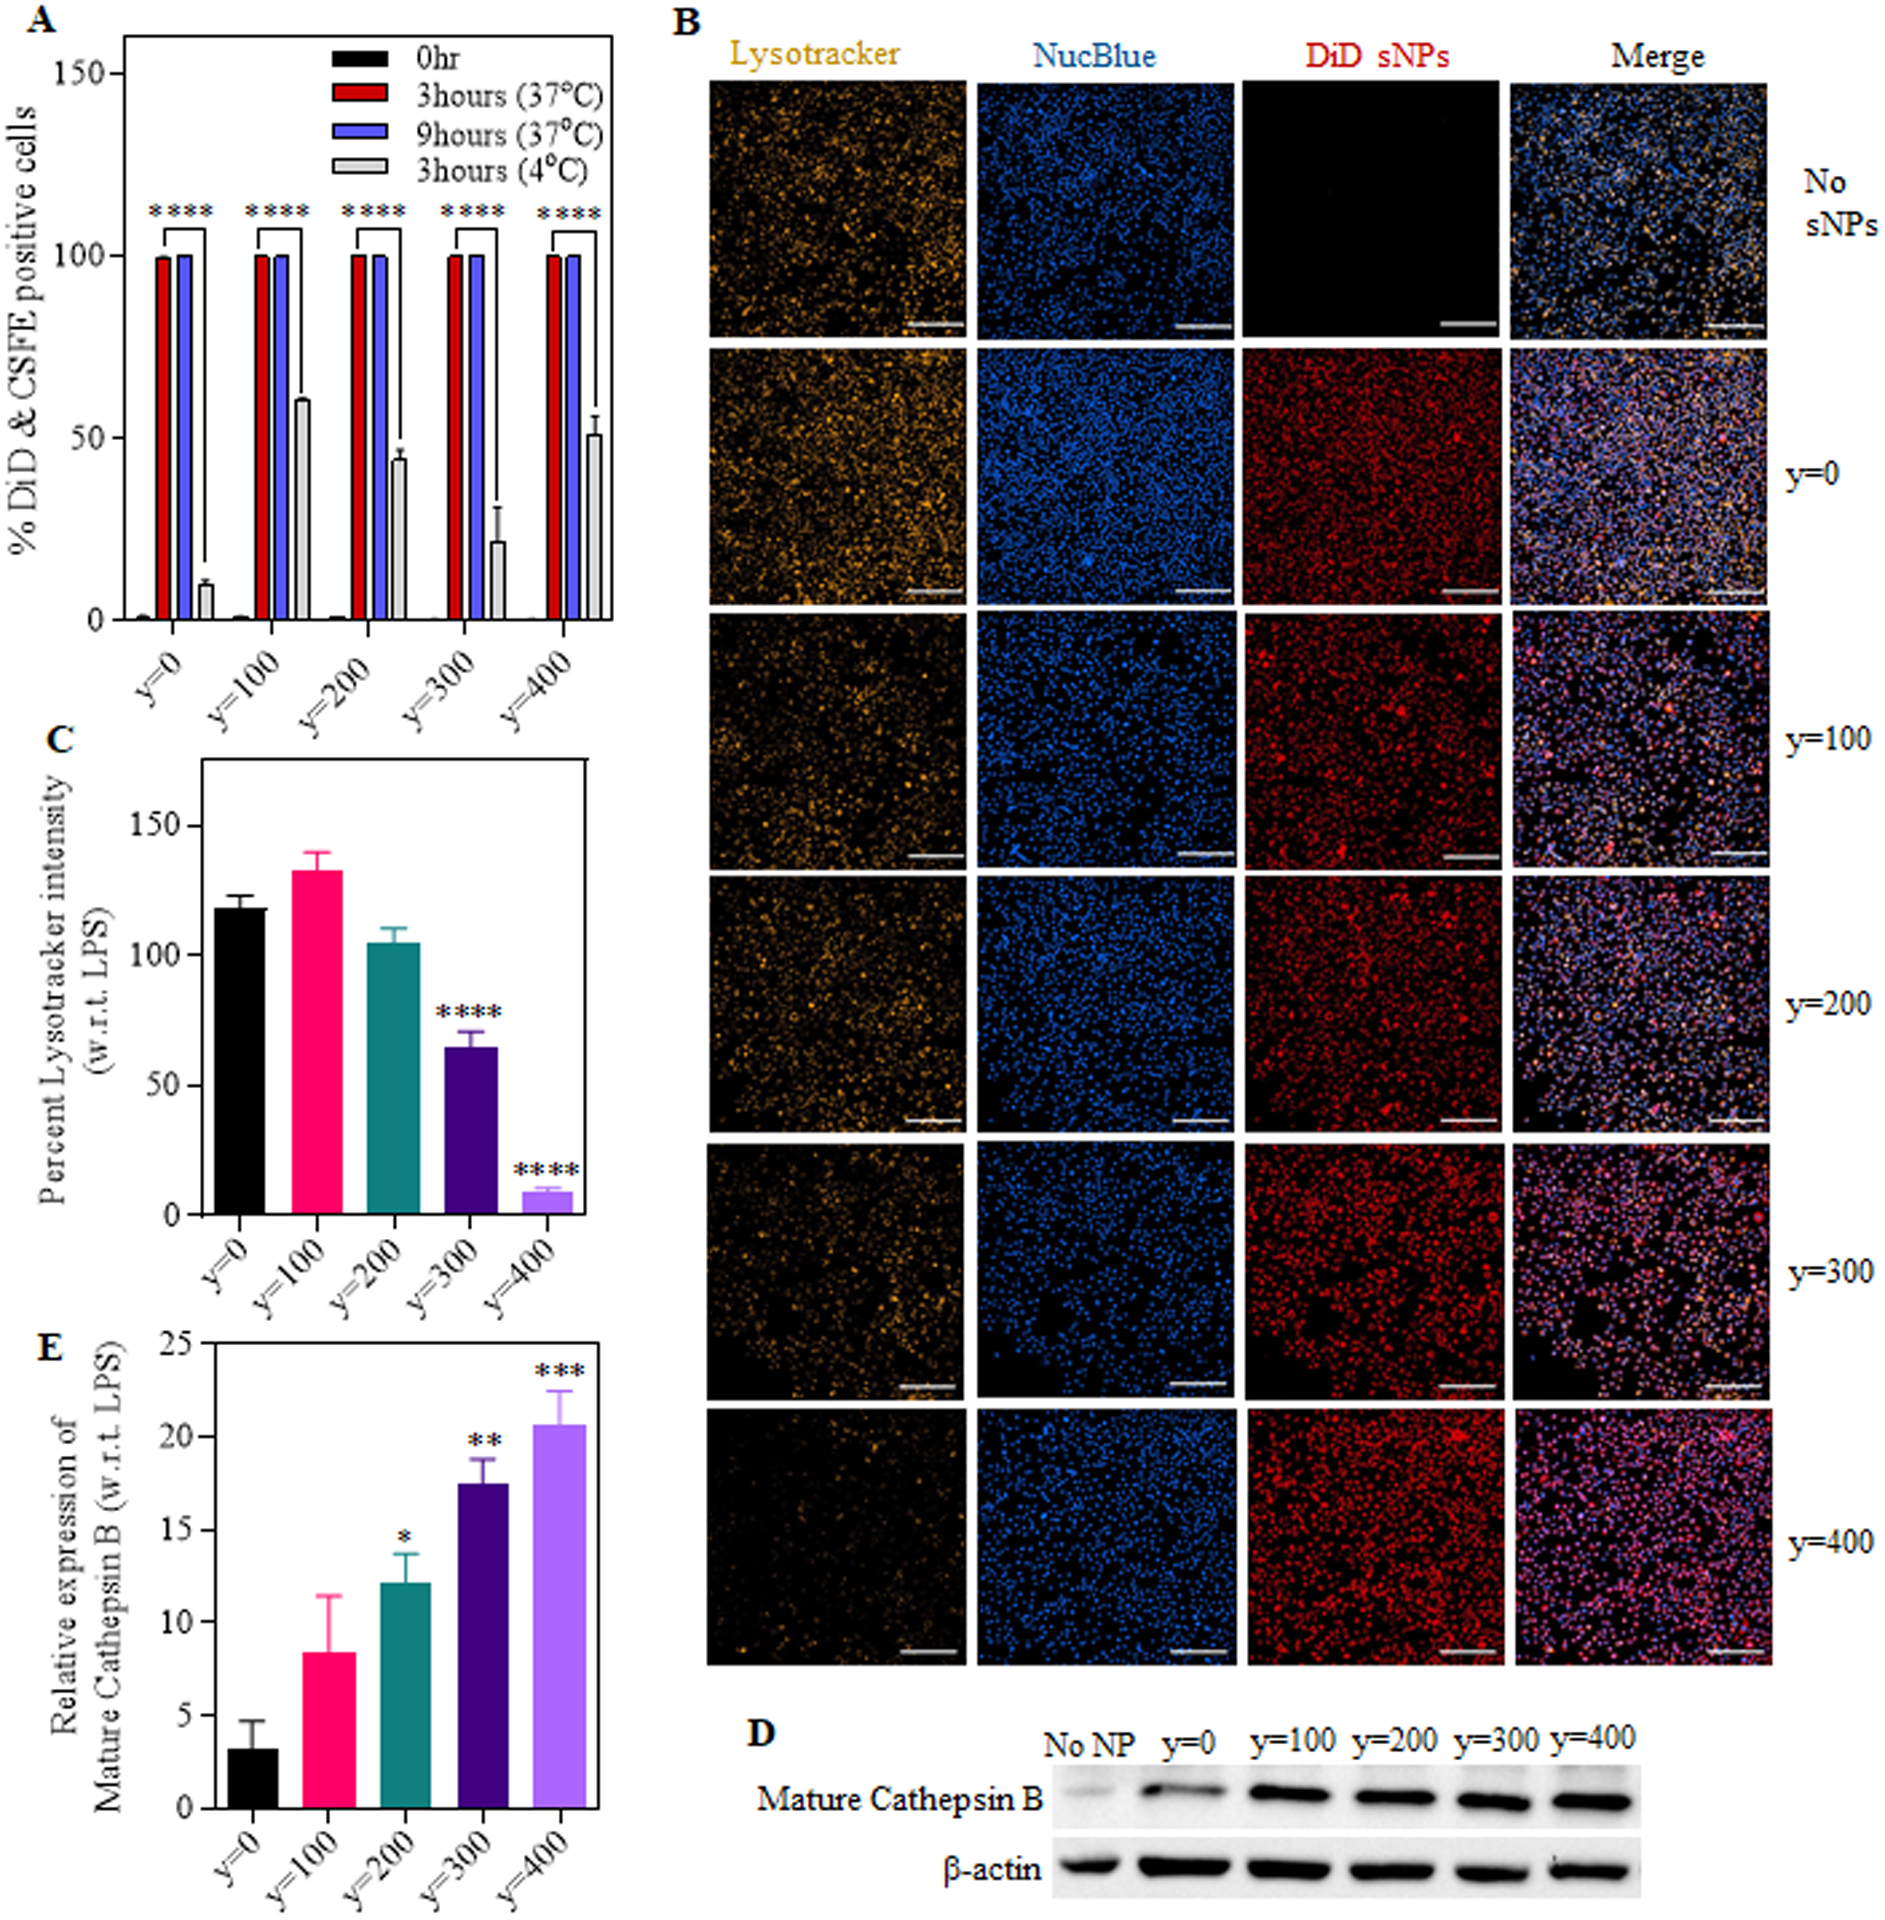
(A) Graph shows the percentage of CSFE labeled cells internalizing DiD dye encapsulated sNPs at different time points (0, 3 and 9 hours). (B) Fluorescent images of iBMDMs treated with DiD sNPs (y=0 to y=400) for 4hours, followed by lysosomal labeling with Lysotracker Red DND-99 and nuclear staining with NucBlue Live ReadyProbes Reagent (Magnification: 20x, Scale bar: 200 μm). (C) Quantification of percentage lysotracker mean fluorescence intensity in sNPs treated iBMDMs with respect to primed iBMDMs. (D) Representative western blot image showing the expression of mature cathepsin B in treated and only LPS primed iBMDMs. (E) Graph displaying a relative expression of mature cathepsin B in sNPs treated iBMDMs compared to only primed ones; normalized with b-actin expression in the respective samples. Data shown here are mean ± S.E.M. (n=3). Statistical significance for (A) was calculated using two-way ANOVA and Dunnett’s multiple comparisons test. Statistical significance for (C) and (E) were calculated by Ordinary one-way ANOVA and Dunnett’s multiple comparisons test. ‘ns’, not significant; *p < 0.05, **p<0.01, ***p < 0.001, ****p<0.0001.