
Figure 6. Intracellular Ca2+ levels and mitochondrial ROS production in the sNPs treated primed-iBMDMs.
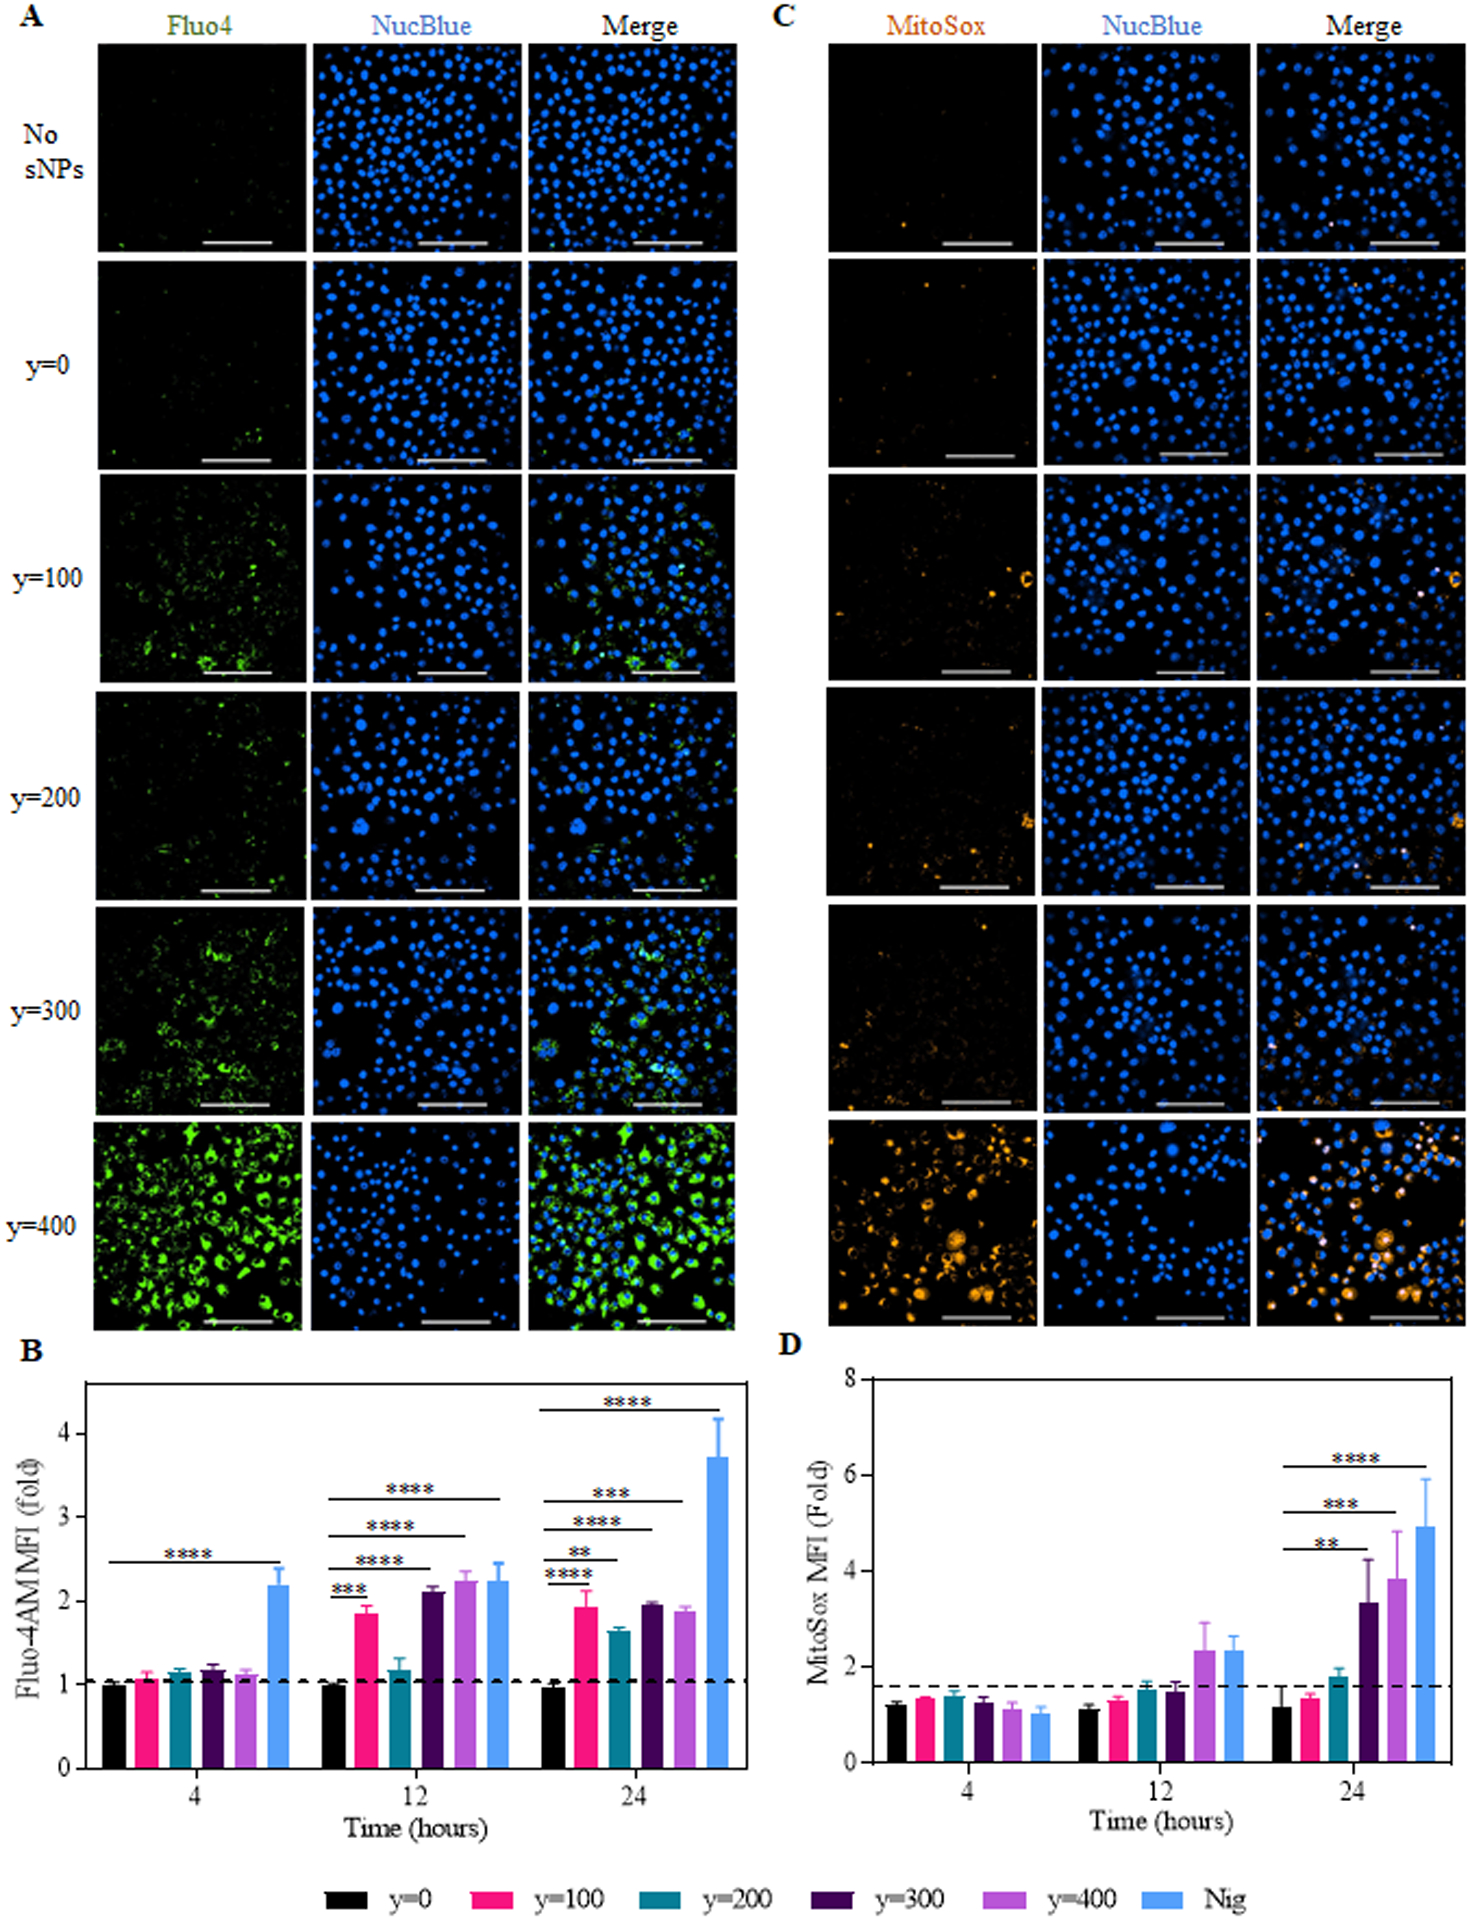
(A) Representative microscopic images of fluo-4AM stained iBMDMs treated with sNPs. Nuclei were stained with NucBlue Live ReadyProbes Reagent. Green shows intracellular calcium, and blue denotes the live-cell nucleus. Images are of 60x magnification (Scale bar: 100 μm). (B) Graph displays time-dependent fold change in the median fluorescence intensity of fluo4 in sNPs (y=0 to 400)-treated cells compared to untreated. Data shown here are mean ± S.E.M. (n=3). Statistical significance was calculated by Ordinary one-way ANOVA and Dunnett’s multiple comparisons test. ‘ns’, not significant; *p < 0.05, **p<0.01, ***p<0.001, ****p<0.0001. (C) Representative confocal images of iBMDMs treated with y=0 to y=400 sNPs for 16hours, followed by MitoSOX and NucBlue staining. MitoSOX (Orange) represents mitochondrial ROS, and NucBlue (Blue) shows live-cell nucleus. Images are of 60x magnification (Scale bar: 100 μm). (D) Graph showing fold change in median fluorescence intensity of MitoSOX stained treated cells with respect to untreated at indicated time points. Data shown here are mean ± S.E.M. (n=6). Statistical significance was calculated by two-way ANOVA and Dunnett’s multiple comparisons test. *p < 0.05, **p<0.01, ***p < 0.001, ****p<0.0001.