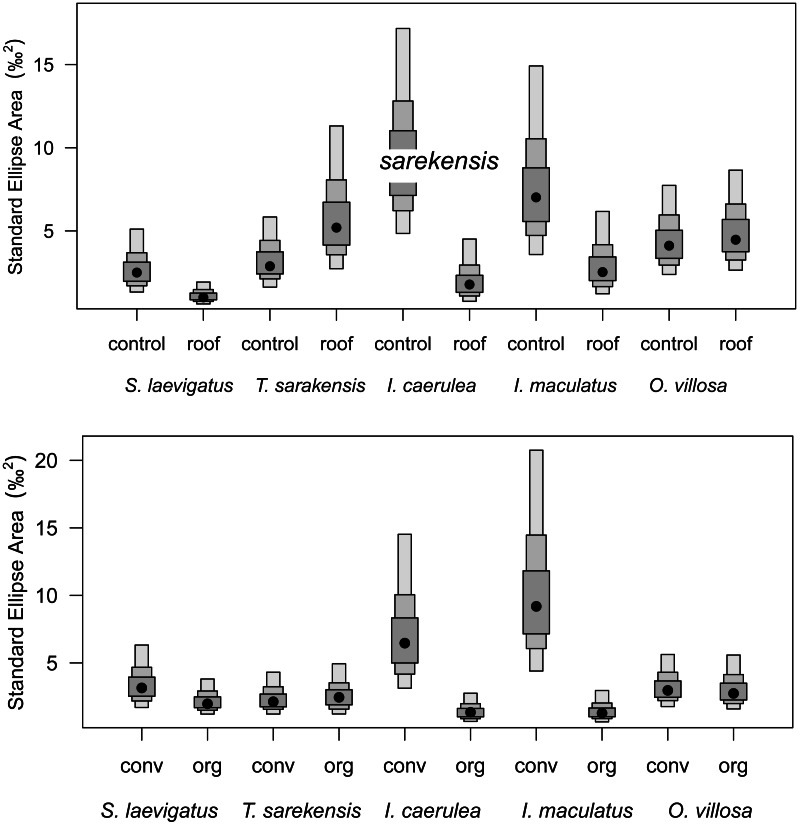
Figure 4. Isotopic niche sizes in drought and control plots and in two different farming systems.
Probability distribution of the sizes of isotopic niches of five microarthropod species (Scheloribates laevigatus, Tectocepheus sarekensis, Isotoma caerulea, Isotomurus maculatus, Orchesella villosa) in the drought (roof) and the control treatment (upper panel), and in conventional (conv) and organic (org) farming systems (lower panel). Points show posterior estimates of the Bayesian standard ellipse area with 50%, 75% and 95% credible intervals (from dark to light gray).

