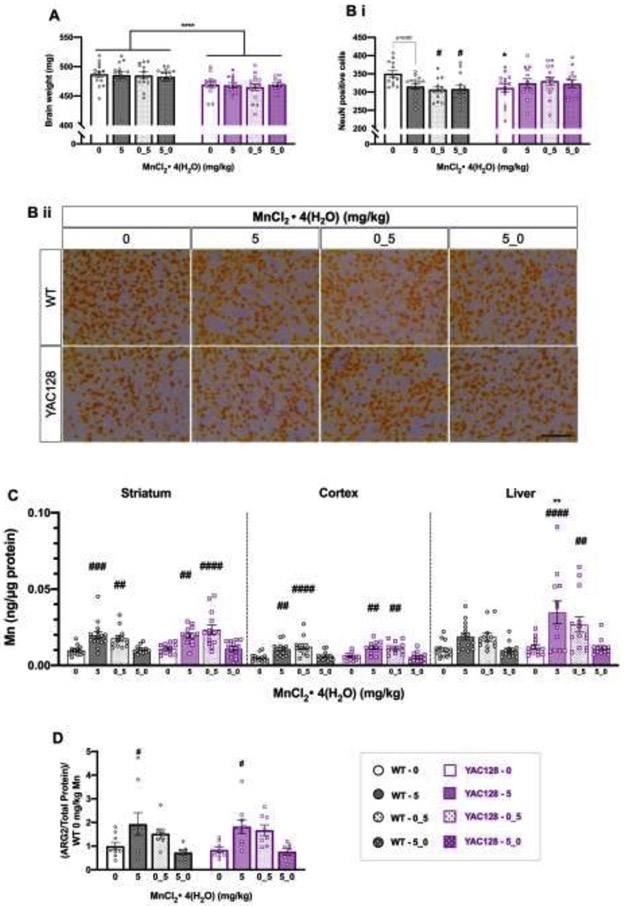
Figure 6.
Post-dissection outcomes for mice used in Study 2. (A) Total brain weights (mg). YAC128 mice weighed less than WT but there was no effect of Mn. (B) (i) YAC128 vehicle mice had a 10% decrease in density of NeuN positive cells compared to WT vehicle (*). Mn led to a significant decrease in NeuN positive cell density in the ”0_5” (p=0.015) and “5_0” groups (p=0.016) compared to WT vehicle (#), but NeuN positive cell density in YAC128 mice was unaffected by Mn treatment. (ii) Representative NeuN positive cells at 40x magnification. Scale bar = 200 μm. (C) Mn levels in striatum (left), cortex (middle) and hepatic (right) tissue for all genotypes and exposure groups. There was a significant increase in Mn levels in all three tissue types following exposure. A # symbol indicates significant difference from vehicle (0) within that genotype. In liver, there was a significant main effect of genotype, but post-hoc Sidak’s revealed that within Mn exposure groups, the only significant genotype difference was between YAC128 and WT that received the continuous 5 mg/kg Mn dose, with accumulation being greater in YAC128 mice compared to WT. (D) ARG2 protein expression by western blot in the striata of a subset of mice from Study 2 (n=7-9 per genotype-treatment group). There was no significant effect of genotype, but Mn increased ARG2 expression. However, only the continuous 5 mg/kg Mn dose led to a significant increase in ARG2 compared to vehicle within each genotype. For all, mean ± S.E.M. plotted unless otherwise noted. Asterisks * indicate genotype effect, pound # indicates Mn effect within genotype. #/* p <0.05, **, p<0.01, *** p<0.001, **** p<0.0001. n=12-15 per genotype-treatment group with approximately equal number of males and females unless otherwise noted.

