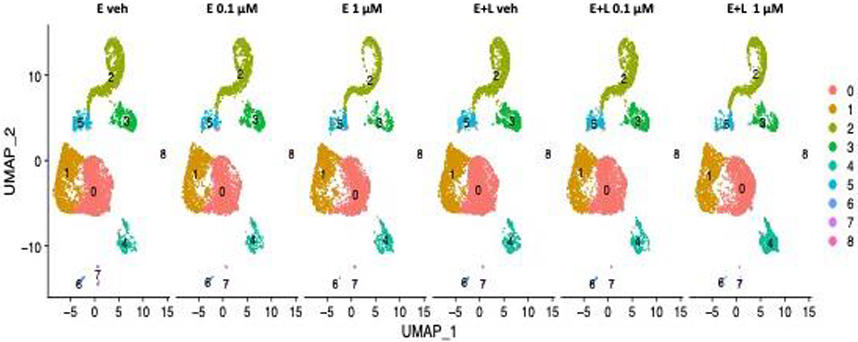
Fig. 2. UMAP clustering identifies 9 cell clusters.

Unsupervised clustering on the gene expression profiles visualized using Uniform Manifold Approximation and Projection (UMAP) plots revealed 9 distinct clusters of cells (clusters 0–8) for all 6 treatment conditions. We identified clusters 0 and cluster 1 as radial glial cells (RG) and cluster 5 as intermediate progenitor cells (IPCs). We assigned clusters 2 and 3 immature postmitotic excitatory neurons (EN) identity of cortical (cluster 2) and thalamic (cluster 3) origin. Cluster 4 we ascribed choroid plexus precursor identity. Clusters 6–8 were predicted to be other RG and mural cells.
