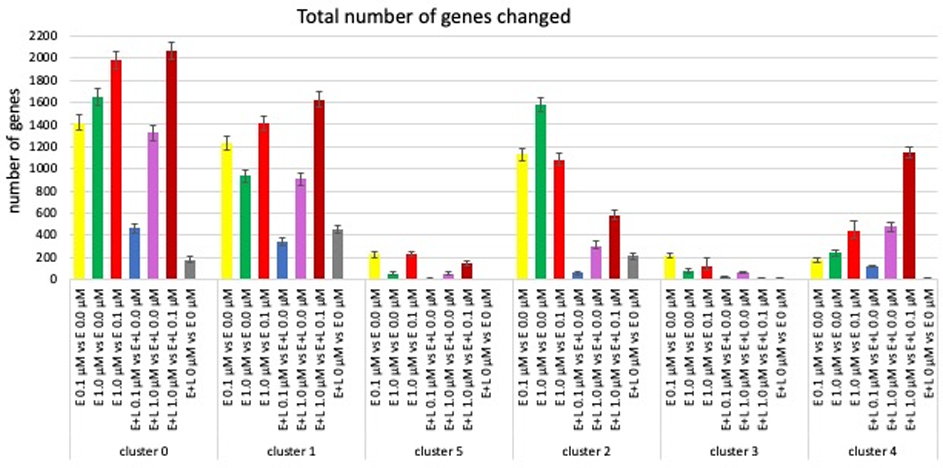
Fig. 5. MeHg causes cluster- and exposure paradigm-specific changes in gene expression.

The number of genes with significantly (FDR < 0.05) changed expression from a total of 33538 genes assessed are shown. The grey bars indicate differences in gene expression between two control cultures. The red bars show number of genes differentially expressed between a low (0.1 μM) and high (1.0 μM) exposure. (Error bars represent 95% confidence levels).
