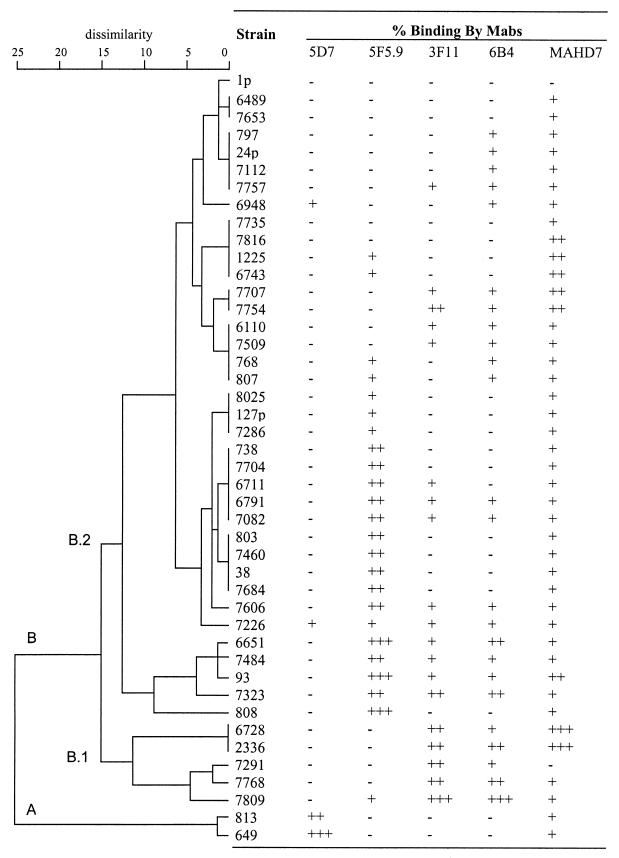
FIG. 2.
Dendrogram obtained from cluster analysis of all H. somnus strains (four replicate experiments) and the relative percent binding by ELISA with each corresponding MAb. Semiquantitative binding was determined as previously described (29). Symbols: −, +, ++, and +++ represent <15%, ≥15 to 50%, >50 to 90%, and >90% of maximum optical density, respectively.

