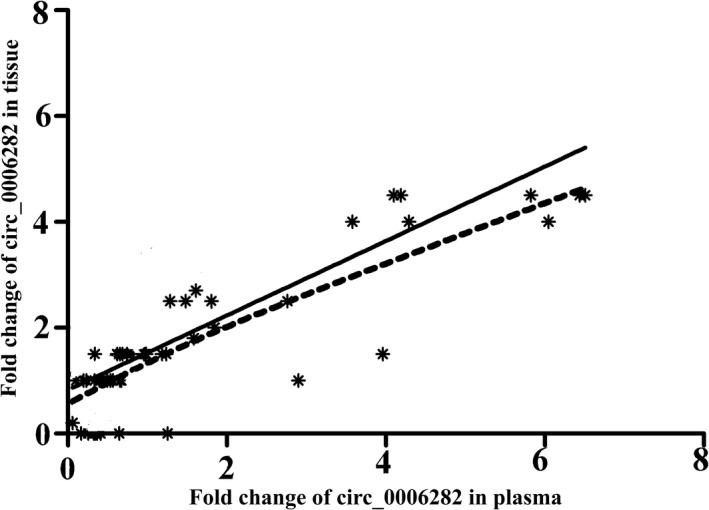
FIGURE 2.

positive correlation of the relative expression of hsa_circ_0006282 between plasma and tissues in GC patients (p < 0.01, R2 = 0.6706)

positive correlation of the relative expression of hsa_circ_0006282 between plasma and tissues in GC patients (p < 0.01, R2 = 0.6706)