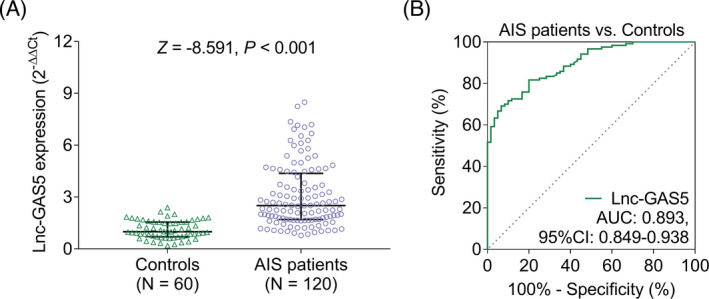
FIGURE 1.

Lnc‐GAS5 levels in patients with AIS and controls. Comparison of lnc‐GAS5 expression levels between patients with AIS and controls (A); the ability of lnc‐GAS5 to differentiate patients with AIS from the controls (B). AIS, acute ischemic stroke; AUC, area under the curve; CI, confidence interval; lnc‐GAS5, long non‐coding RNA growth arrest‐specific 5
