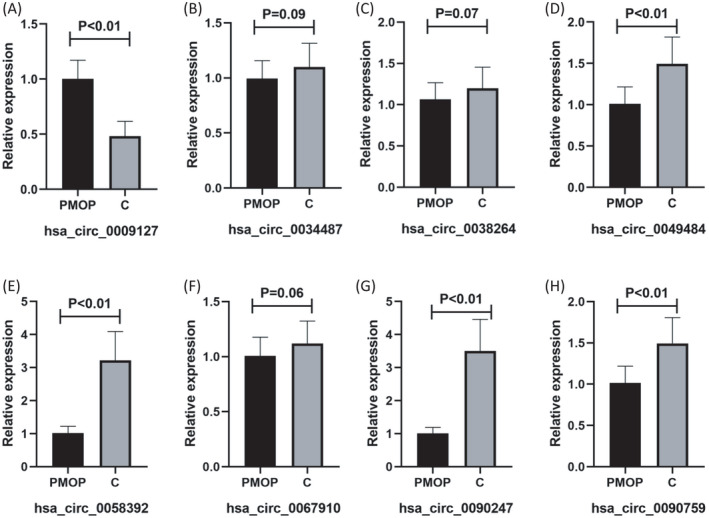
FIGURE 4.

RT‐qPCR validation of target circRNA in the PMOP group vs control group. Expression levels of (A) hsa_circ_0009127, (B) hsa_circ_0034487, (C) hsa_circ_0038264, (D) hsa_circ_0049484, (E) hsa_circ_0058392, (F) hsa_circ_0067910, (G) hsa_circ_0090247, and (H) hsa_circ_0090759
