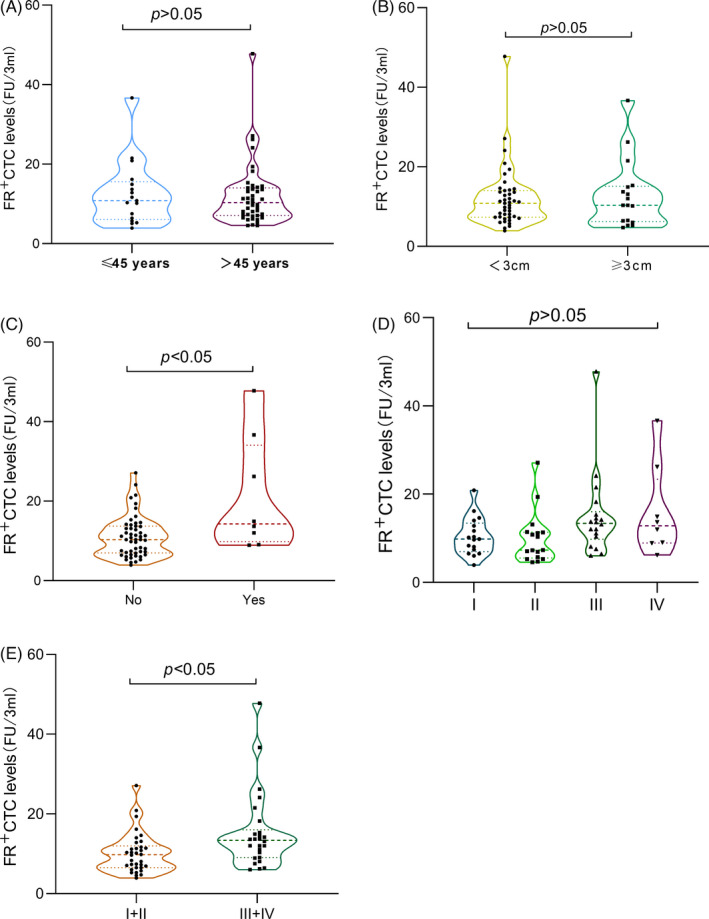
FIGURE 2.

Folate receptor‐positive circulating tumor cells (FR+CTC) levels and clinical traits. The violin plot showing the median and IQR of FR+CTC levels in stratified analysis of breast cancer patients. Every points denoted every participant. (A) Comparison of CTC levels in patients with ≤45 years and >45 years. (B) Comparison of CTC levels in patients of tumor maximum diameter ≥3 cm and <3 cm. (C) Comparison of CTC levels in patients without metastasis and with distant metastasis. (D) Comparison of CTC levels in patients of TNM stage (I, II, III, and IV). (E) Comparison of CTC levels in patients of TNM stage (I and II, III and IV)
