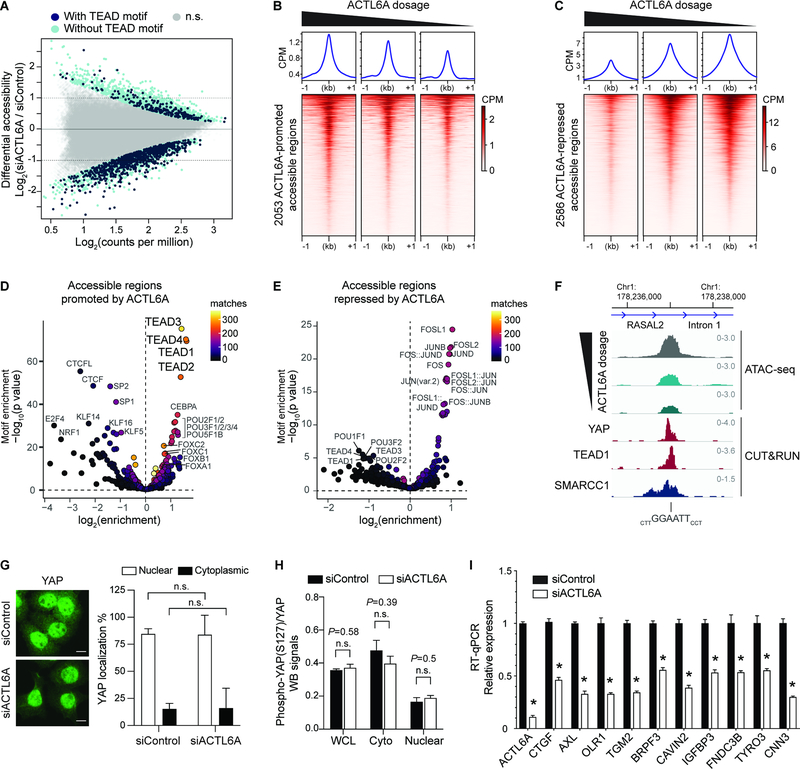
Figure 3. Genome-wide accessible chromatin profiling identifies ACTL6A-dependent regulatory regions in SCC cells.
(A) MA plot for ATAC-seq analysis in FaDu SCC cells 72-hours after transfection with ACTL6A siRNA (siACTL6A) and control siRNA (siControl). Color coded are significantly altered peaks with predicted TEAD-binding motifs (navy) and without TEAD motif (light blue). FDR<0.05. n.s.: not significant. n=2 experiments.
(B and C) Heat maps and metagene plots for ATAC-seq analysis across ACTL6A-promoted (B) or ACTL6A-repressed (C) accessible regions with different levels of ACTL6A reduction by siRNA in FaDu SCC cells. CPM: counts per million.
(D and E) Enrichment for predicted transcription-factor (TF) binding motifs in ACTL6A-promoted (D) or ACTL6A-repressed (E) accessible regions. Matches: number of peaks containing matched TF-binding motifs.
(F) Genome browser tracks showing regions with differential reduction of accessibility upon different ACTL6A knockdown from ATAC-seq. The sites contained TEAD motifs and were also bound by SMARCC1, YAP and TEAD1 identified by CUT&RUN.
(G) Immunofluorescence and quantifications of % of cells with nuclear or cytoplasmic YAP showing unaltered YAP subcellular localization in FaDu SCC cells 72 hours after ACTL6A siRNA (siACTL6A) knockdown versus siRNA control (siControl). Scale bars: 10 μm. n.s.: not significant.
(H) Quantifications for Western blot (WB) signals of phospho-S127 YAP normalized to total YAP levels. Samples including whole cell lysates (WCL), cytoplasmic extracts (cyto) and nuclear extracts (nuclear) from FaDu cells 72 hours after siRNA transfection. n=3 experiments.
(I) RT-qPCR showing YAP/TEAD target genes regulated by ACTL6A. n=3 experiments. Error bars indicate SEM. *P < 0.05.

