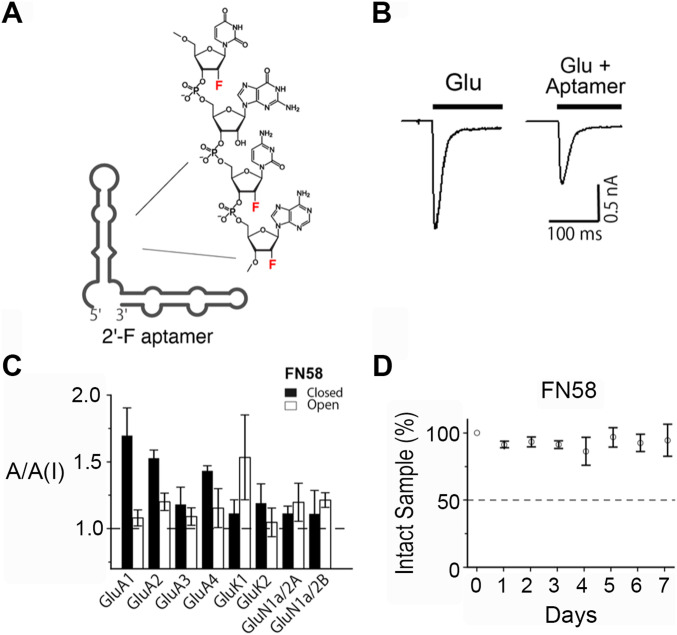
Figure 1. 2′-F modified RNA aptamers.
(A) An Mfold predicted secondary structure of FN1040 as an example of 2′-fluoro substitution on the ribose sugar. (B) A pair of representative whole-cell current responses to glutamate (1 mM) in the absence (left trace) and presence of FN1040 (right trace, 1 μM FN1040) from an HEK-293 cell that transiently expressed GluA2Qflip AMPA receptors. The bar shows the time course of glutamate exposure to the cell. (C) Inhibition of FN58, as an example, on glutamate receptors each of which was transiently expressed in HEK-293 cells. The GluA2 AMPA receptor used for aptamer assay was GluA2Q. For all the assays, 2 μM of FN58 was tested with two glutamate concentrations (mM), that is, 0.05 and 3 for GluA1, 0.1 and 3 for GluA2, GluA3 and GluA4, 0.05 and 3 for GluK1 and GluK2, and 0.02 and 0.05 for GluN1a/2A and GluN1a/2B, respectively. Low and high glutamate concentrations corresponded to the assay of an aptamer for the closed- and open-channel forms of a receptor (Li & Niu, 2004). The ratio of the whole-cell current amplitude in the absence and presence of an aptamer or A/A(I) is plotted with the SD. For each A/A(I) value, at least three data points were collected from at least three cells. (D) In vitro stability of FN58. FN58 was mixed with CSF, and incubated at 37°C for variable lengths of time (days). Samples were visualized on PAGE. The intensity of the ethidium bromide–stained bands was normalized to the control (band from day 0). The average of three sets of samples were used for the plot. The error bars represent SD.

