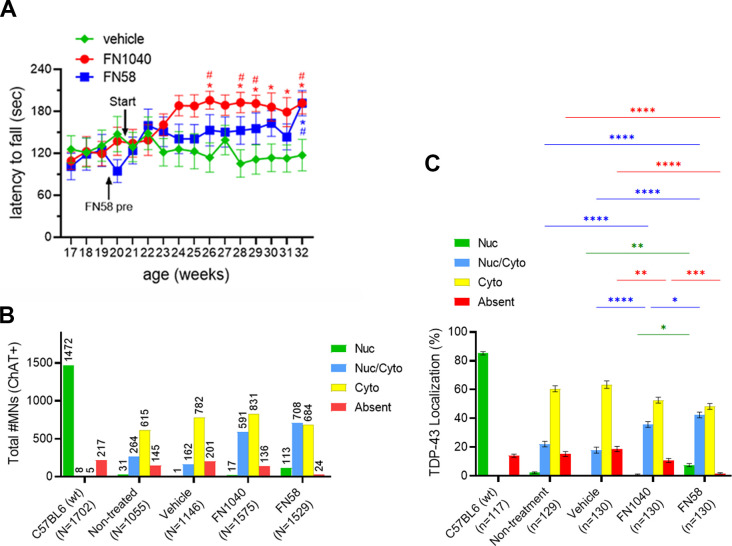
Figure S4. Latency to fall from the rotarod task (actual time) and TDP-43 localization analyzed per anterior horn in long-term administration of FN1040 or FN58.
(A) Latency to fall (seconds) from the rotarod task in long-term administration of FN1040 or FN58. Mice received either FN1040 (n = 13) or FN58 (n = 13) were able to retain on the rotarod longer than the vehicle-treated mice (n = 13). Start: the time initiating administration of test concentration of aptamers. FN58-pre: administration of initial dose of FN58 (5 μM). Mean ± SEM. two-way ANOVA, followed by Tukey’s multiple-comparisons test, *P < 0.05 versus vehicle, #P < 0.05 versus initial value (Table S9). (B) The total number and the proportions of each TDP-43 localization of ChAT-positive cells, respectively. 10 anterior horn cells per mice were analyzed. Total number of MNs used for TDP-43 localization analysis; C57BL6 (n = 1,702), nontreated (n = 1,055), vehicle (n = 1,146), FN1040 (n = 1,575), and FN58 (n = 1,529). (C) The proportion of TDP-43 localization analyzed per anterior horn. Total number of anterior horns used for analysis; C57BL6 (n = 117), non-treatment (n = 129), vehicle (n = 130), FN1040 (n = 130), and FN58 (n = 130). Mean ± SEM, two-way ANOVA followed by Tukey’s multiple-comparisons test (green bars and asterisks; Nuc, blue bar and asterisk; Nuc/Cyto, red bar and asterisk; absent). *P < 0.05, **P < 0.01, ***P < 0.001, ****P < 0.0001 (Table S10).

