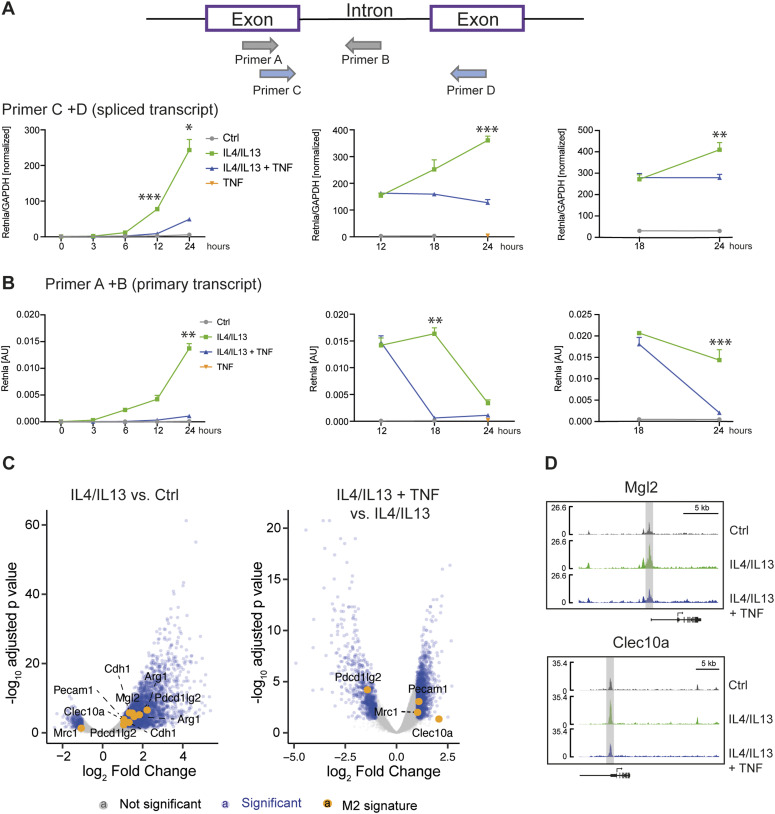
Figure 4. TNF selectively controls M2 gene transcription.
(A) Overview of the experimental design. RNA from wild-type BMDMs left untreated (Ctrl), stimulated with IL4/IL13, IL4/IL13 + TNF, or TNF was used for qRT-PCR. TNF was added at the same time like IL4/IL13 (left), 12 h after IL4/IL13 stimulation (middle) or 18 h afterwards (right). The last time point was always 24 h of IL4/IL13 stimulation. qRT-PCR for Retnla was analyzed. Data shown are the mean fold-increase of the Ctrl group. (B) Primary transcript qRT-PCR of the samples shown in (A). Superscripts show statistical significance between IL4/IL13 and IL4/IL13 + TNF. See also Fig S5. (C) Wild-type BMDMs were stimulated with IL4/IL13 or IL4/IL13 + TNF for 24 h or left untreated (Ctrl). Volcano plots of ATACseq data set showing IL4/IL13 versus Ctrl or IL4/IL13 + TNF versus IL4/IL13. Significantly changed sites are colored in blue and a selection of M2 genes are highlighted in orange. (D) Example of successfully identified accessible sites (ACS) in ATACseq data set. Significantly changed transcription sites of the ACS nearby Mgl2 and Clec10a are highlighted in grey. n = 3 biological replicates.

