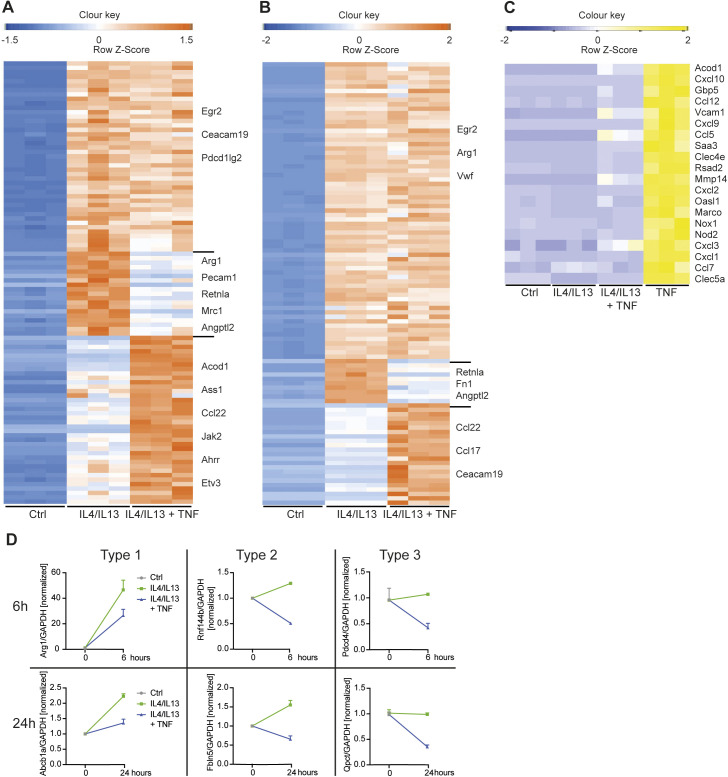
Figure S3. TNF selectively blocks M2 gene expression (related to Fig 2).
(A, B) Heat maps showing 100 most regulated genes from profile GSE169348 after 6 h (A) or 24 h (B). (C) Heat map shows TNF-up-regulated genes after 24 h of stimulation. (D) Verification of genes, which are type 1, 2, or 3, by qRT-PCR in wild-type BMDMs after 6 or 24 h of stimulation.

