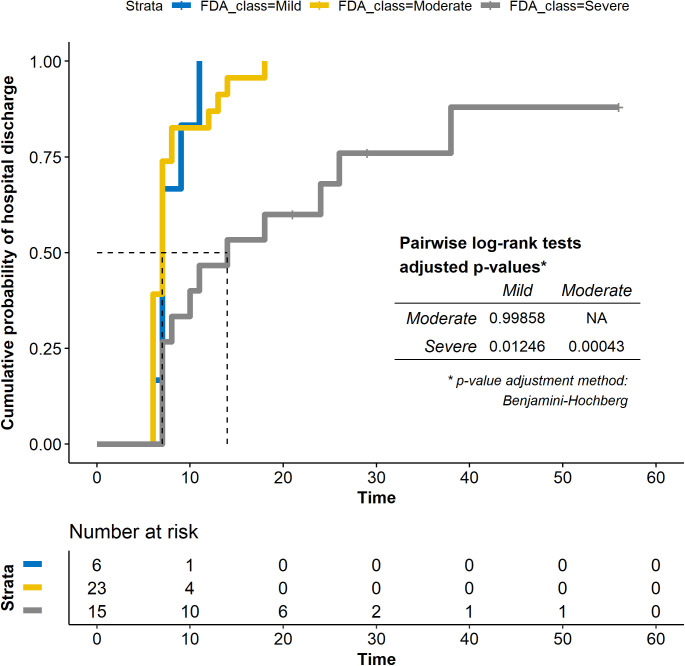
Figure S3. Post hoc analysis on hospital discharge, by baseline disease severity.
Reverse Kaplan Meier plot showing the cumulative incidence of hospital discharge by baseline severity (mild, moderate or severe COVID-19, according to FDA definition) (23).

