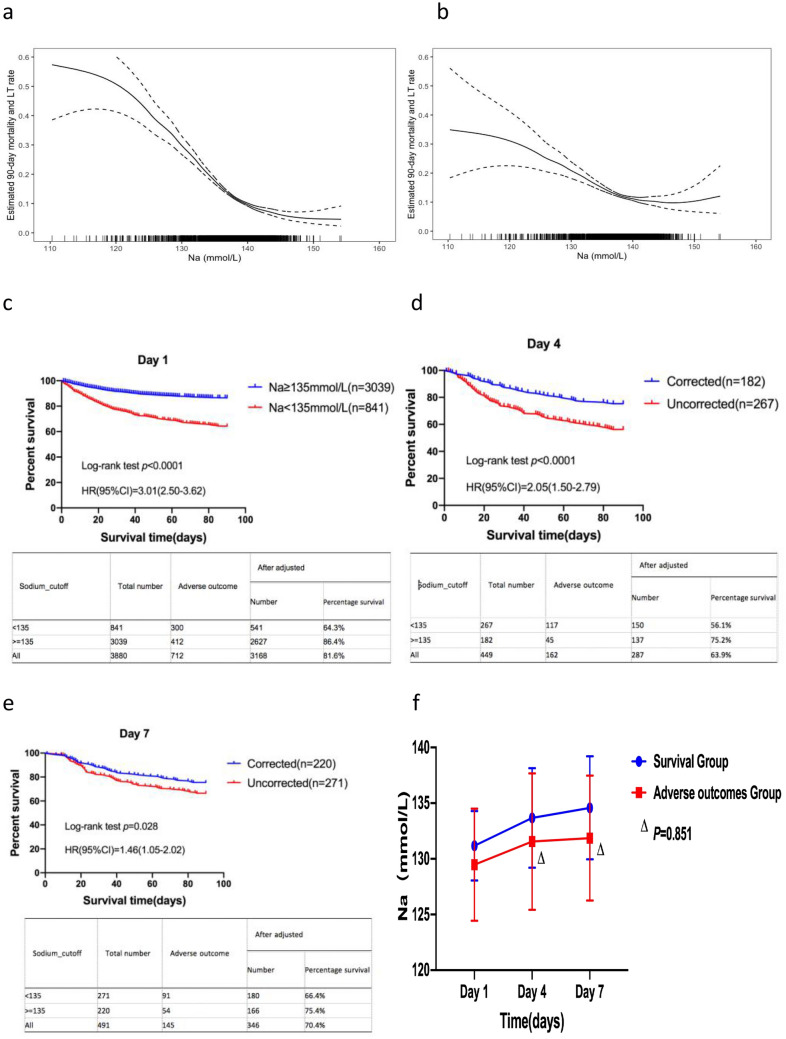
Fig. 2.
a The association between Na level and 90-day adverse outcomes in patients with AoCLD (unadjusted). b The association between Na level and 90-day adverse outcomes in patients with AoCLD (adjusted). c Survival analysis, based on the Na cut-off value, using the Kaplan–Meier method. d Kaplan–Meier curves of patients with corrected or uncorrected hyponatremia on day 4 after admission. e Kaplan–Meier curves of patients with corrected or uncorrected hyponatremia on day 7 after admission. f Dynamic changes in Na level between the survival group and adverse outcome group 7 days after admission

