. 2021 Dec 25;38(4):433–441. doi: 10.5511/plantbiotechnology.21.0105a

Figure 4. Histochemical, microscopic, molecular analyses of T0 calli and Hygromycin leaf painting assay of independent transgenic lines. A. Transformed (T) calli checked for the GUS activity on 1 mM X-Gluc containing selection media. The bluish spots indicate the transformed tissues expressing GUS. B. GFP expression in transformed callus tissues observed under an epifluorescence microscope, at 12,000 ms exposure time. The untransformed (UT) controls showed neither GUS nor GFP activity. C. PCR confirmation of the presence of 301 bp GUS (top) and 303 bp GFP insert in independent T0 events of calli, corresponding to the 300 bp band of the reference DNA ladder (L). For Positive (P), plasmid DNA of pCAMBIA1303 was used and for negative (N), genomic DNA of UT callus was used as templates. D. Screening of T0 events based on hygromycin resistance. For each plant, a set of triplicates with three leaves on each plate was maintained. The leaves that remained largely green after 7 days of treatment, were scored as antibiotic-resistant and the leaves that looked mostly necrotic like UT leaves were considered as hygromycin sensitive. E. PCR confirmation for the presence of GUS amplicon (top) and 300 bp HPT insert (bottom) in resistant leaves, in presence of reference DNA ladder (L). F. GUS histochemical test for T1 leaves of HPT/GUS positive plants. G. DOT-BLOT image of denatured genomic DNA of positive T1 plants, developed after hybridisation with the GUS probe. Each sample was blotted in individual squares and as duplicates to avoid false positives. Denatured plasmid DNA of pCAMBIA1303 was used as (+)ve control and that of UT sample as (−)ve control.
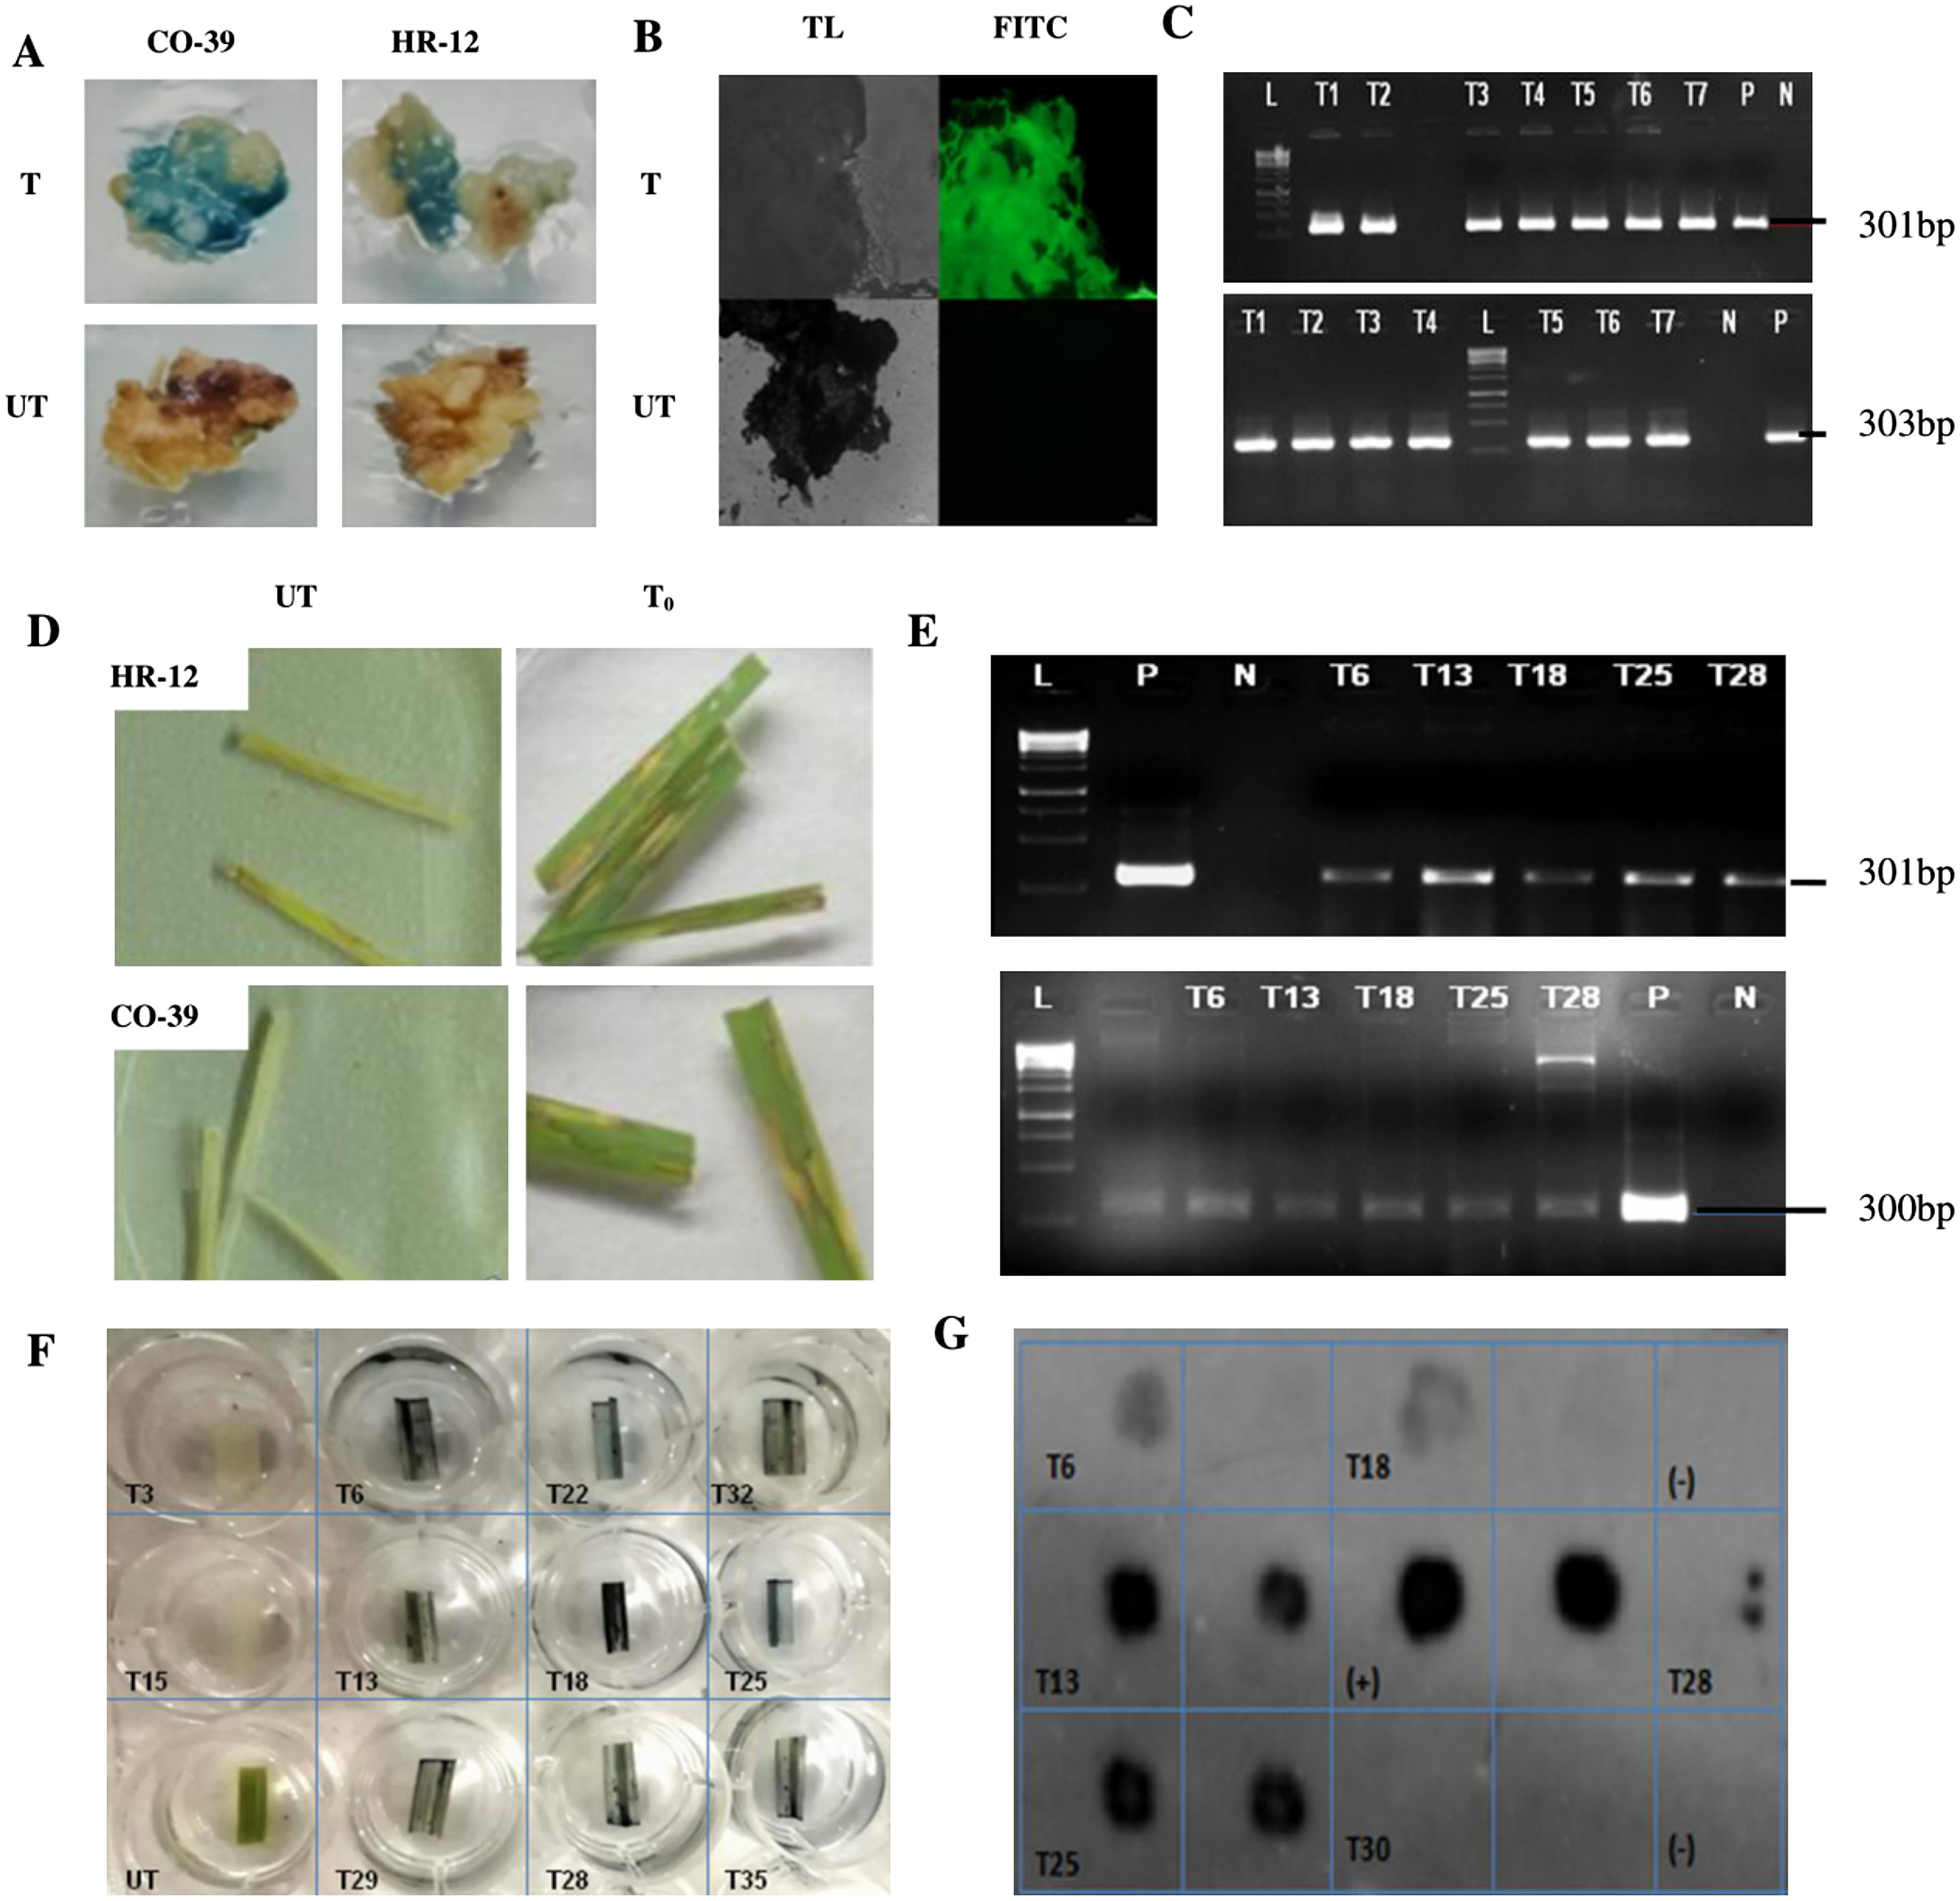
Figure 4. Histochemical, microscopic, molecular analyses of T0 calli and Hygromycin leaf painting assay of independent transgenic lines. A. Transformed (T) calli checked for the GUS activity on 1 mM X-Gluc containing selection media. The bluish spots indicate the transformed tissues expressing GUS. B. GFP expression in transformed callus tissues observed under an epifluorescence microscope, at 12,000 ms exposure time. The untransformed (UT) controls showed neither GUS nor GFP activity. C. PCR confirmation of the presence of 301 bp GUS (top) and 303 bp GFP insert in independent T0 events of calli, corresponding to the 300 bp band of the reference DNA ladder (L). For Positive (P), plasmid DNA of pCAMBIA1303 was used and for negative (N), genomic DNA of UT callus was used as templates. D. Screening of T0 events based on hygromycin resistance. For each plant, a set of triplicates with three leaves on each plate was maintained. The leaves that remained largely green after 7 days of treatment, were scored as antibiotic-resistant and the leaves that looked mostly necrotic like UT leaves were considered as hygromycin sensitive. E. PCR confirmation for the presence of GUS amplicon (top) and 300 bp HPT insert (bottom) in resistant leaves, in presence of reference DNA ladder (L). F. GUS histochemical test for T1 leaves of HPT/GUS positive plants. G. DOT-BLOT image of denatured genomic DNA of positive T1 plants, developed after hybridisation with the GUS probe. Each sample was blotted in individual squares and as duplicates to avoid false positives. Denatured plasmid DNA of pCAMBIA1303 was used as (+)ve control and that of UT sample as (−)ve control.