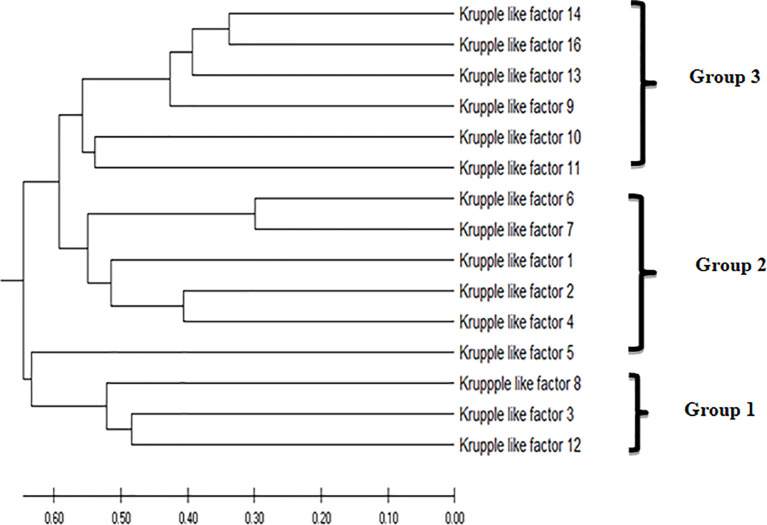
Figure 2.
The evolutionary history was inferred using the unweighted pair group method with arithmetic mean (UPGMA). The optimal tree with the sum of branch length = 7.54632578 is shown. The tree is drawn to scale, with branch lengths in the same units as those of the evolutionary distances used to infer the phylogenetic tree. The evolutionary distances were computed using the Poisson correction method (39) and are in the units of the number of amino acid substitutions per site. This analysis involved 15 amino acid sequences. All ambiguous positions were removed for each sequence pair (pairwise deletion option). There were a total of 602 positions in the final dataset. Evolutionary analyses were conducted in MEGA X (40).

