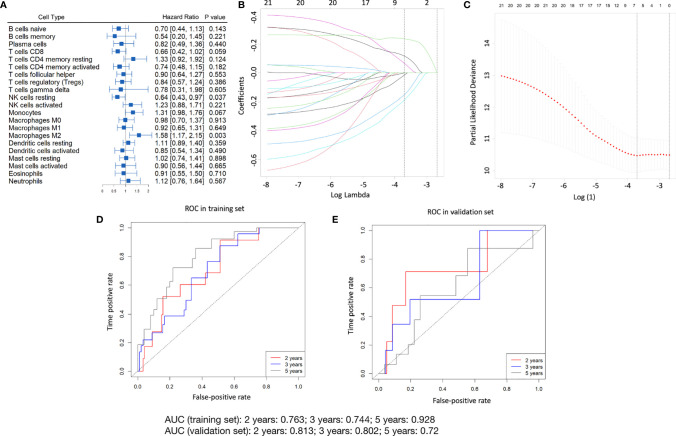
Figure 2.
Construction of the immunoscore model. (A) The forest plot shows the relationship of different subpopulations of immune cells to OS in the training set. (B) Distribution of LASSO factors for 21 immune cell fractions. The dashed curve represents values selected via 10-fold crossover validation. (C) Crossover validation of a 10-fold choice of adjustment parameters from the LASSO model. The bias likelihood deviation was expressed in log(λ) whenever λ was the adjustment parameter. Values of the bias-likelihood deviation are displayed, and the error bands indicate S.E. of the mean according to the minimal criterion and the 1-S.E. criterion; vertical dashed lines were plotted at the optimal point. Numbers at the top denote numbers for cell categories implicated in the LASSO model for (B, C) The prognostic accuracy of the immunoscore as a continuous variable as assessed by ROC analysis in the training set (D) and validation set (E).

