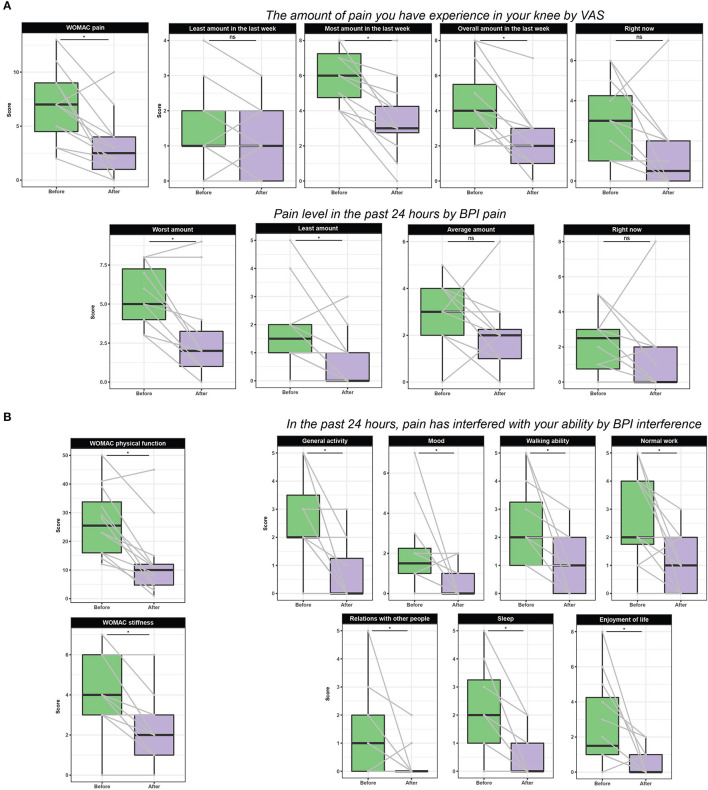
Figure 1.
Effect of TC on pain (A), physical function, and stiffness parameters (B). Data are presented as boxplots and scores from the same subject is connected with a gray line. Statistical significance of differences was determined at an alpha level adjusted for multiple comparisons (i.e., Benjamin-Hochberg adjustment). WOMAC: Pain subscale from 7 (no pain) to 35 (extreme pain); Stiffness subscale from 2 (no stiffness) to 10 (extreme stiffness); Physical function subscale from 17 (no difficulties with activity of daily living) to 85 (extreme difficulties with activity of daily living). Overall WOMAC scale from 26 (best possible score) to 130 (worst possible score) due to knee pain. VAS (visual analog scale) from 0 (no knee pain) to 10 (unbearable pain). BPI (Brief Pain Inventory) from 0 (no pain) to 10 (unbearable pain).

